3 Data-check M1
I loaded the data from the directory L:\\GBW-0080_BC_Lab\\Data\\FAT-ILC\\Giacomo
Table 3.1 reports the number of unknown values for each variable.
Table 3.2 shows the summary of the available information. skim_type, skim_variable, n_missing, complete_rate indicate the type of the variable, the name of the variable, the number of missing values and the proportion of complete values for each variable. Date.min, Date.max, Date.median, Date.n_unique indicate the minimum, maximum, the median and the number of unique values for the date variables. factor.n_unique, factor.top_counts indicate the number of unique values and the values with top counts for the categorical variables. numeric.p0, numeric.p25, numeric.p50, numeric.p75, numeric.p100 describe the percentiles of the numerical variable in the database.
As we will see later, several variables in the database result with a complete rate very low. The following variables have a complete rate of 0.
[1] "comorbidities, age_menarche (y), oral_anticonceptive_duration (y), age_first_pregnancy (y), ER_Allred_biopsy, ER_H_score_biopsy, PR_Allred_biopsy, PR_H_score_biopsy, Ki67_biopsy (%), number_of_suspected_foci, chemotherapy_1st_line_metastatic, HER2_1st_line_metastatic, endocrinetherapy_1st_line_metastatic, treatment_1st_line_other_metastatic, treatment_reduction_1st_line_metastatic, clinical_response_1st_line_metastatic, chemotherapy_2nd_line_metastatic, HER2_2nd_line_metastatic, endocrinetherapy_2nd_line_metastatic, treatment_2nd_line_other_metastatic, treatment_reduction_2nd_line_metastatic, clinical_response_2nd_line_metastatic, second_progression_distant_disease_metastatic, radiotherapy_all_metastatic, chemotherapy_number_lines_all_metastatic, HER2_number_lines_all_metastatic, endocrinetherapy_number_lines_all_metastatic, treatment_other_all_metastatic"The following variables have a complete rate above 0% but below 5%.
[1] "comments"Instead, in ?tbl-skimsf are reported the variables that have a complete rate of at least 75%.
3.0.1 Missing values
Figure 3.1 displays in decreasing order the absolute frequency of the occurrence of missing values for each patient that has at least one missing value. For sake of simplicity, they are displayed separately depending on the number of the missing values. The same was performed for the variables, as displayed in Figure 3.2.
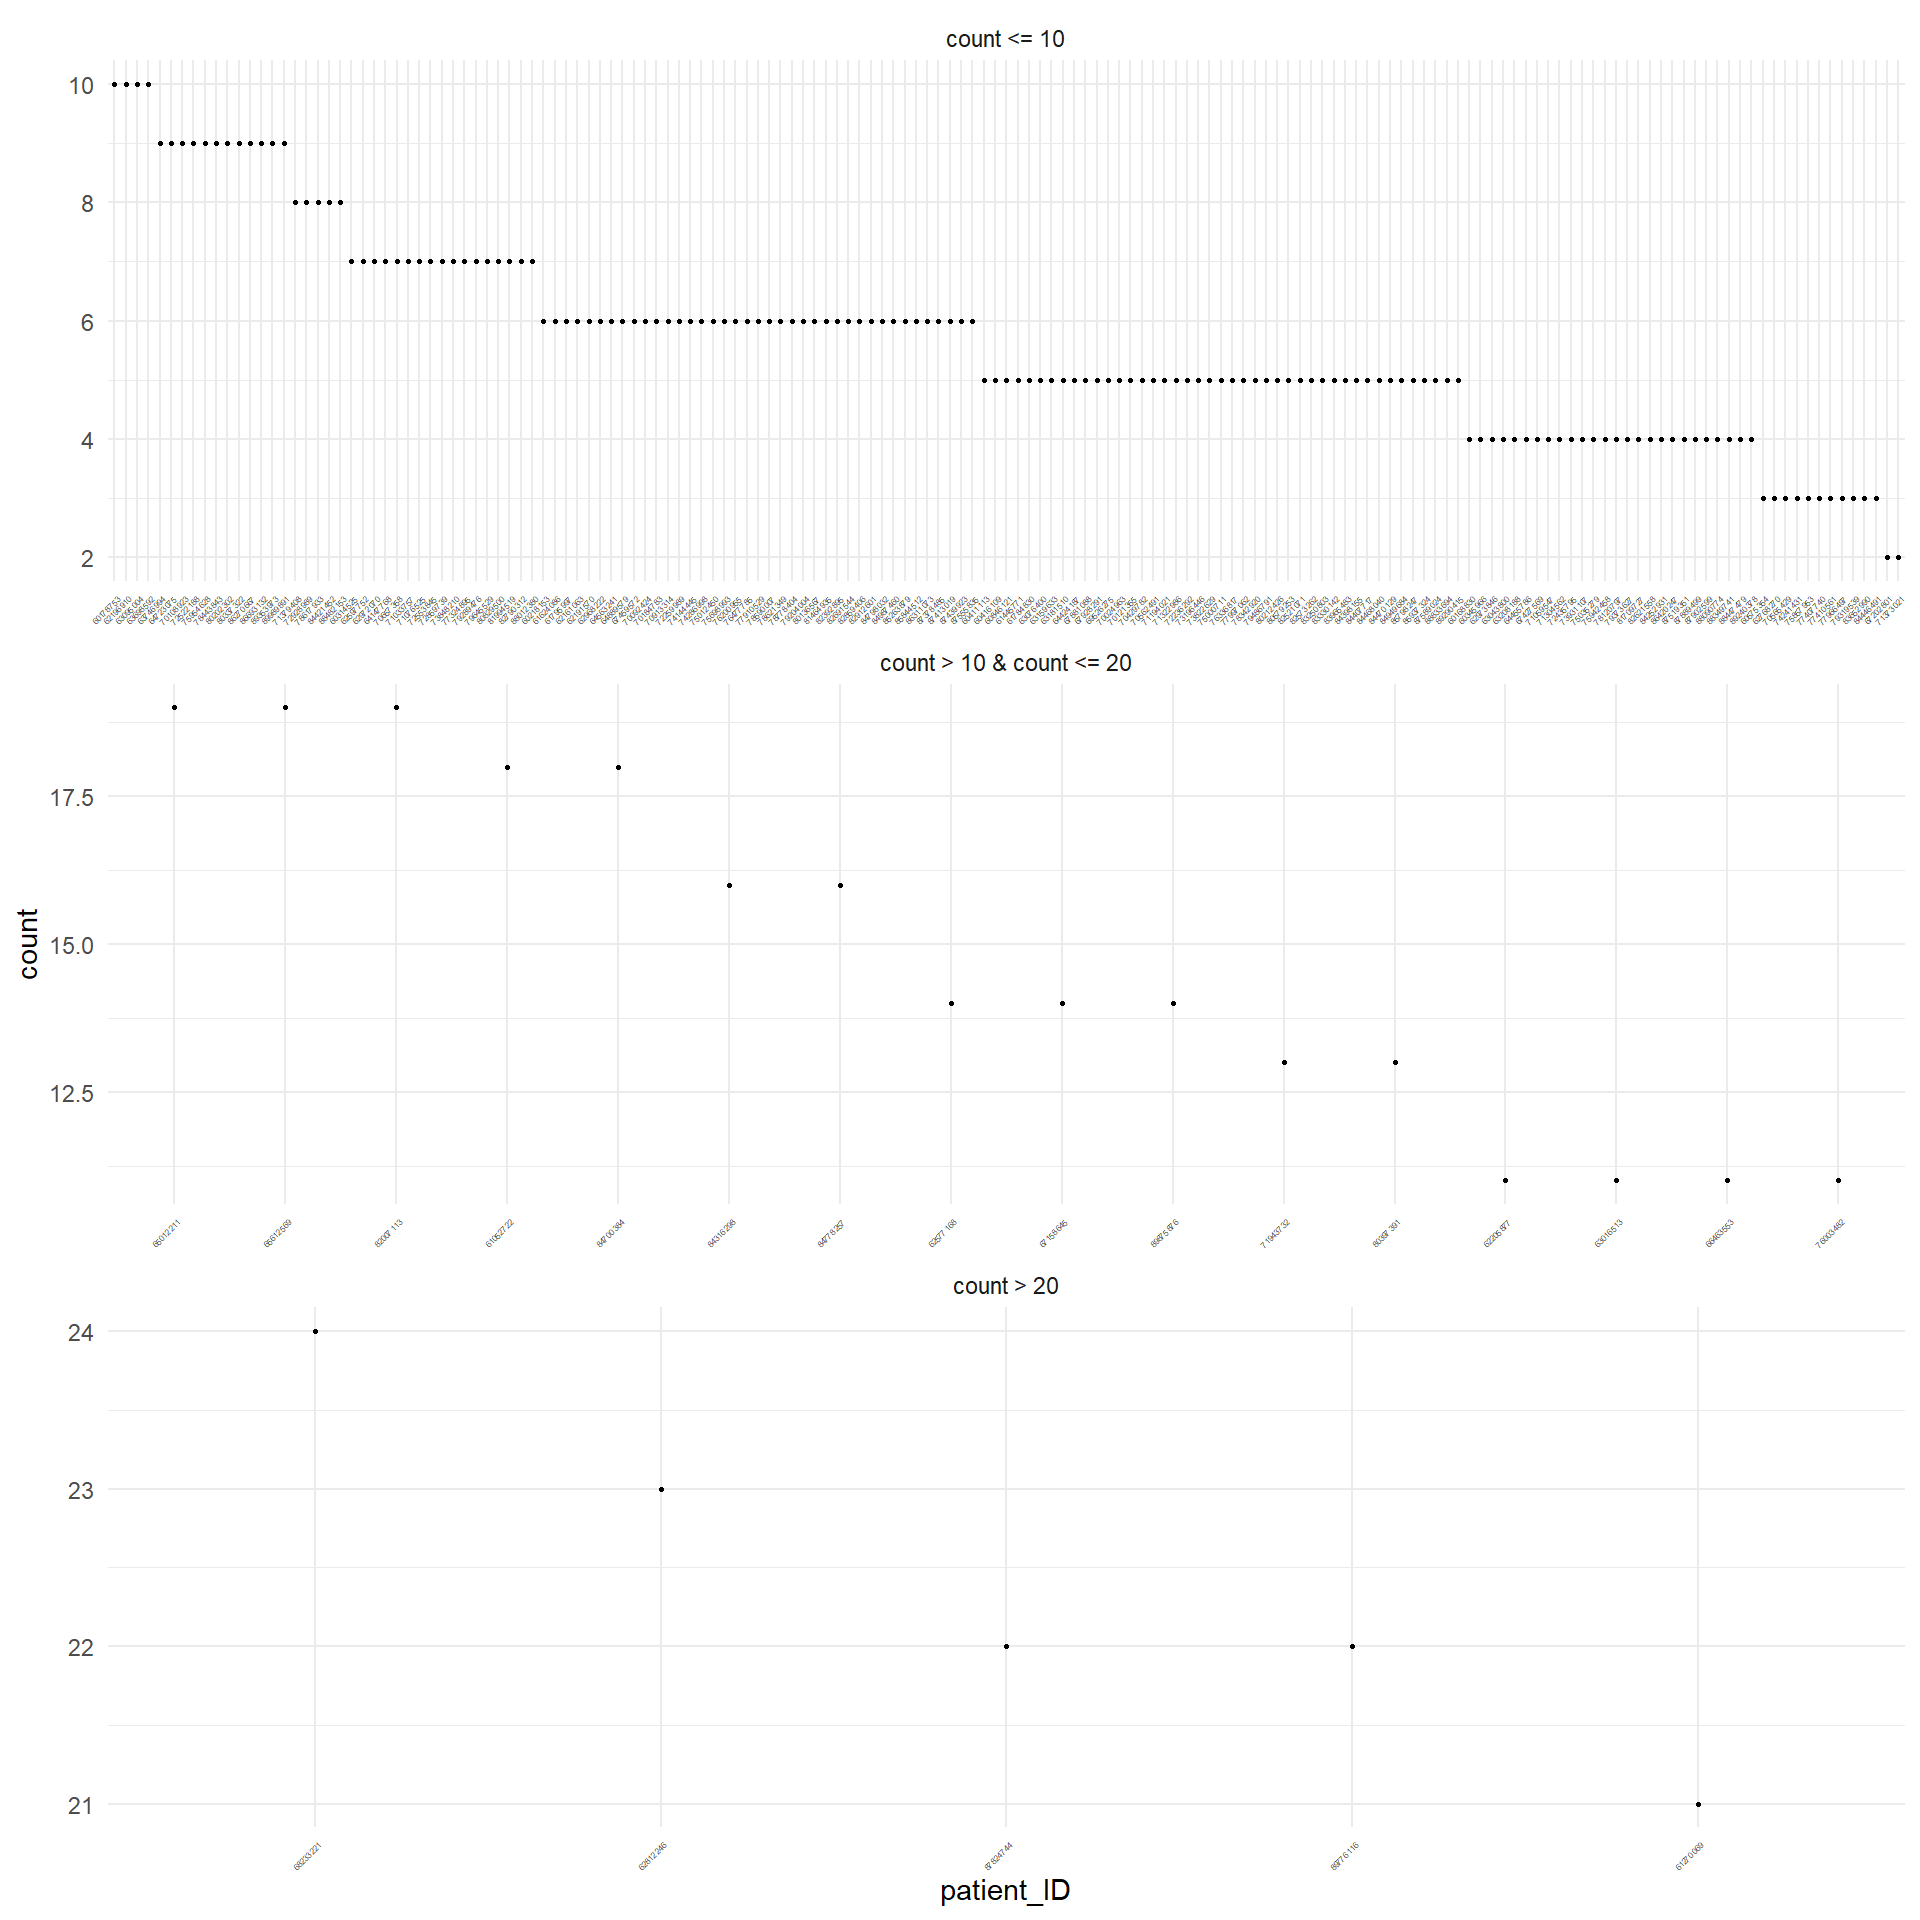
Table 3.3 reports the number of missing values for each patients.
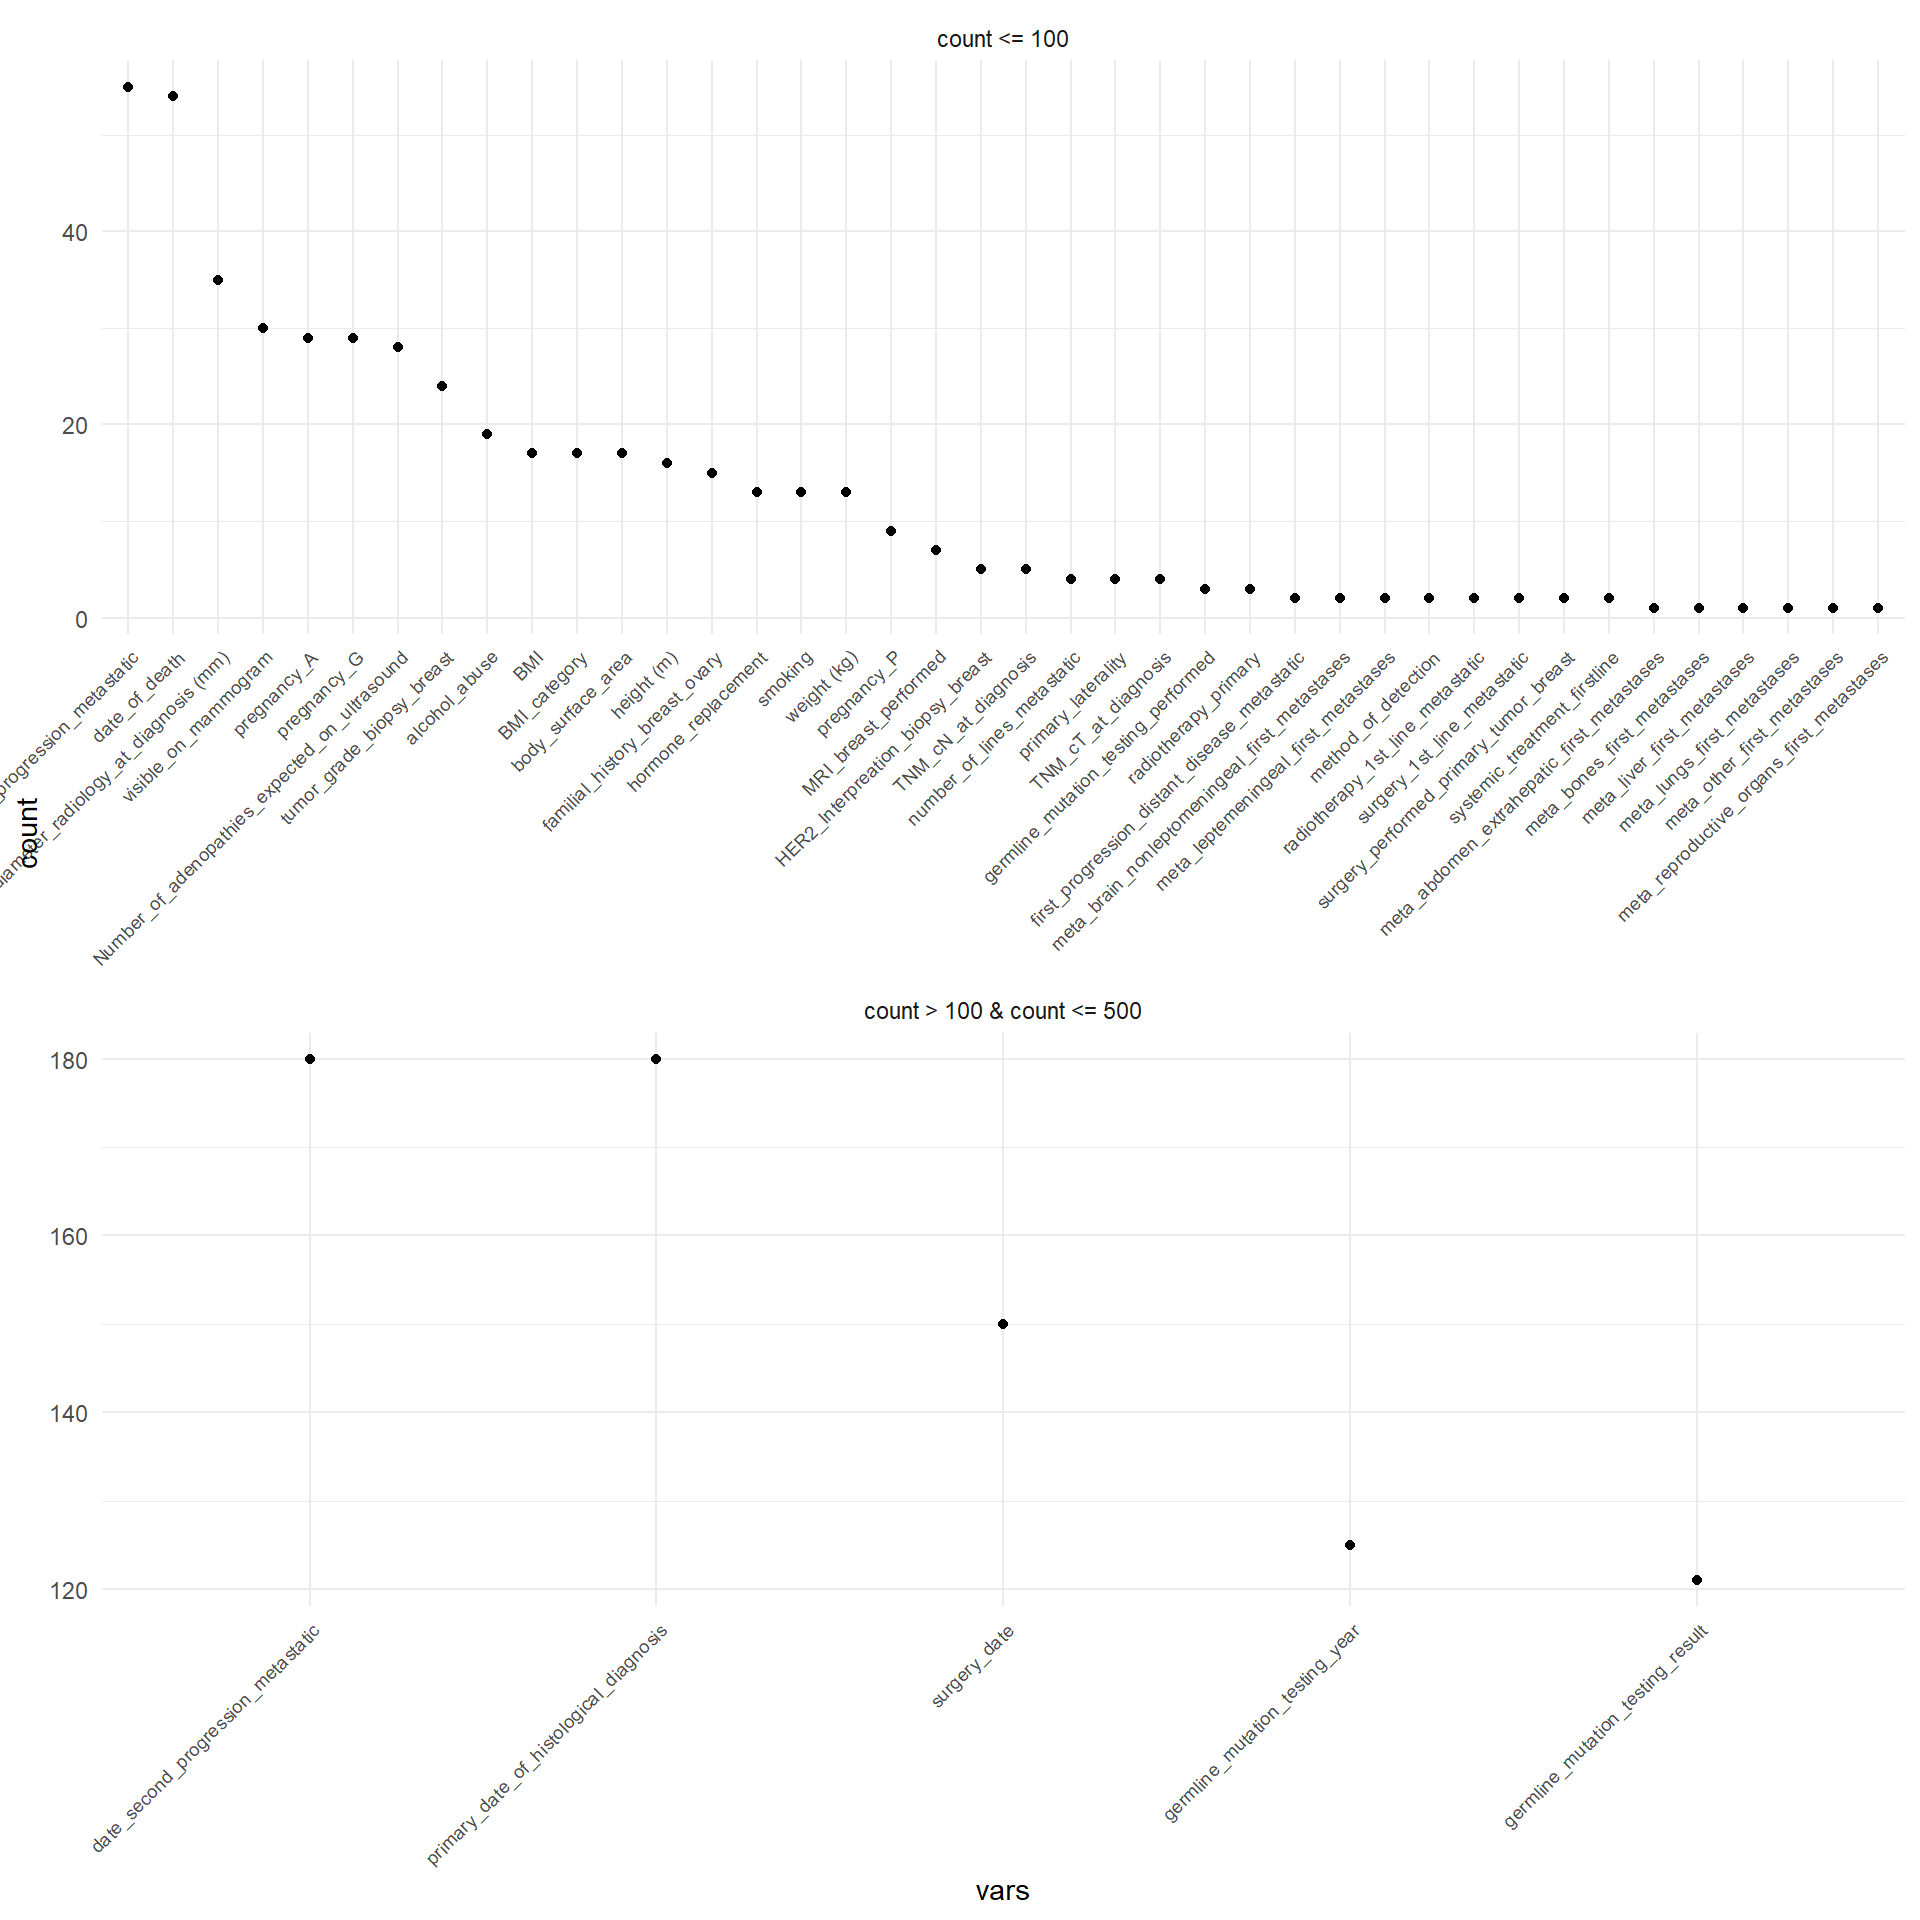
Table 3.4 reports the number of missing values for each variable.
3.0.2 Event history check
For M1: - Date of birth < date of diagnosis < date of first progression < date of death - date of diagnosis <= date of follow up Leuven <= date of follow up everywhere <= date of death - date of diagnosis <= date of surgery <= date of follow up everywhere <= date of death (but independent of date first progression)
I did not find any issue with the dates.
# A tibble: 0 × 4
# Groups:   patient_ID [0]
# ℹ 4 variables: patient_ID <chr>, name <chr>, value <date>, diff <drtn>
# A tibble: 0 × 5
# Groups: patient_ID [0]
# ℹ 5 variables: patient_ID <chr>, name <chr>, value <date>, diff <dbl>,
# i <dbl># A tibble: 0 × 5
# Groups: patient_ID [0]
# ℹ 5 variables: patient_ID <chr>, name <chr>, value <date>, diff <dbl>,
# i <dbl>3.0.3 Subset of variables : baseline characteristics #visible_on_mammogram
We now limit the analysis to the variables of interest. For the moment I will extract the following variables: method_of_detection, age_at_diagnosis (y), age_category, BMI, BMI_category, menopausal_status,oral_anticonceptive_use, hormone_replacement, smoking, alcohol_abuse, hypertension, hyperlipidemia, diabetes, pregnancy_P, germline_mutation_testing_performed, germline_mutation_testing_result, germline_mutation_testing_year, familial_history_breast_ovary, visible_on_mammogram, TNM_cT_at_diagnosis, TNM_cN_at_diagnosis, TNM_cM_at_diagnosis, tumor_grade_biopsy_breast, ER_Interpretation_biopsy_breast, PR_Interpretation_biopsy_breast, HER2_Interpreation_biopsy_breast,radiotherapy_primary, radiotherapy_1st_line_metastatic, meta_brain_nonleptomeningeal_first_metastases, meta_leptemeningeal_first_metastases, meta_bones_first_metastases, meta_skin_first_metastases, meta_lungs_first_metastases, meta_liver_first_metastases, meta_abdomen_extrahepatic_first_metastases, meta_reproductive_organs_first_metastases, meta_lymph_nodes_first_metastases, meta_other_first_metastases
oral_anticonceptive_use has a lot of unknowns (63),for the moment is excluded from the analysis. hormone_replacement has 66 unknonws and 28 NAs. For surgery_type_breast there are 148 NAs. For diameter of the tumor we have different variables, what are the one we want to consider? diameter_mammogram_at_diagnosis, diameter_ultrasound_at_diagnosis, diameter_MRI_at_diagnosis, diameter_radiology_at_diagnosis (mm). radiotherapy_2nd_line_metastatic we have 56 NAs.
Table 3.5 reports the first description of the variables included in the analysis.
| Overall (N=180) |
|
|---|---|
| method_of_detection | |
| radiologically detected | 19 (10.6%) |
| symptoms | 159 (88.3%) |
| Missing | 2 (1.1%) |
| age_at_diagnosis (y) | |
| Mean (SD) | 66.3 (12.4) |
| Median [Min, Max] | 67.0 [33.0, 92.0] |
| age_category | |
| < 40 | 4 (2.2%) |
| ≥ 80 | 31 (17.2%) |
| 40 - 49 | 12 (6.7%) |
| 50 - 59 | 39 (21.7%) |
| 60 - 69 | 50 (27.8%) |
| 70 - 79 | 44 (24.4%) |
| BMI | |
| Mean (SD) | 26.4 (5.22) |
| Median [Min, Max] | 25.7 [18.4, 41.6] |
| Missing | 17 (9.4%) |
| BMI_category | |
| < 18.5 | 3 (1.7%) |
| ≥18,5 and <25 | 68 (37.8%) |
| ≥25 and <30 | 56 (31.1%) |
| ≥30 | 36 (20.0%) |
| Missing | 17 (9.4%) |
| menopausal_status | |
| Postmenopausal | 149 (82.8%) |
| pre- and perimenopausal | 31 (17.2%) |
| smoking | |
| active | 30 (16.7%) |
| former | 20 (11.1%) |
| no | 117 (65.0%) |
| Missing | 13 (7.2%) |
| alcohol_abuse | |
| no | 144 (80.0%) |
| yes | 17 (9.4%) |
| Missing | 19 (10.6%) |
| hypertension | |
| no | 96 (53.3%) |
| yes | 84 (46.7%) |
| hyperlipidemia | |
| no | 124 (68.9%) |
| yes | 56 (31.1%) |
| diabetes | |
| no | 156 (86.7%) |
| type 2 | 24 (13.3%) |
| pregnancy_P | |
| 0 | 23 (12.8%) |
| 1 | 50 (27.8%) |
| 2 | 52 (28.9%) |
| 3 | 32 (17.8%) |
| 4 | 9 (5.0%) |
| 5 | 3 (1.7%) |
| 7 | 1 (0.6%) |
| 8 | 1 (0.6%) |
| Missing | 9 (5.0%) |
| germline_mutation_testing_performed | |
| no | 119 (66.1%) |
| yes | 58 (32.2%) |
| Missing | 3 (1.7%) |
| germline_mutation_testing_result | |
| ATM | 1 (0.6%) |
| BRCA2 | 2 (1.1%) |
| CHEK2 | 2 (1.1%) |
| negative | 54 (30.0%) |
| Missing | 121 (67.2%) |
| germline_mutation_testing_year | |
| Mean (SD) | 41800 (11300) |
| Median [Min, Max] | 45000 [2000, 45900] |
| Missing | 125 (69.4%) |
| familial_history_breast_ovary | |
| no | 110 (61.1%) |
| yes | 55 (30.6%) |
| Missing | 15 (8.3%) |
| visible_on_mammogram | |
| no | 17 (9.4%) |
| yes | 133 (73.9%) |
| Missing | 30 (16.7%) |
| TNM_cT_at_diagnosis | |
| T1a | 1 (0.6%) |
| T1b | 4 (2.2%) |
| T1c | 19 (10.6%) |
| T2 | 47 (26.1%) |
| T3 | 43 (23.9%) |
| T4a | 1 (0.6%) |
| T4b | 26 (14.4%) |
| T4c | 6 (3.3%) |
| T4d | 22 (12.2%) |
| Tx | 7 (3.9%) |
| Missing | 4 (2.2%) |
| TNM_cN_at_diagnosis | |
| N0 | 40 (22.2%) |
| N1 | 57 (31.7%) |
| N2 | 19 (10.6%) |
| N3 | 1 (0.6%) |
| N3a | 15 (8.3%) |
| N3b | 11 (6.1%) |
| N3c | 31 (17.2%) |
| x | 1 (0.6%) |
| Missing | 5 (2.8%) |
| TNM_cM_at_diagnosis | |
| M1 | 180 (100%) |
| tumor_grade_biopsy_breast | |
| 2 | 141 (78.3%) |
| 3 | 15 (8.3%) |
| Missing | 24 (13.3%) |
| ER_Interpretation_biopsy_breast | |
| negative | 16 (8.9%) |
| positive | 164 (91.1%) |
| PR_Interpretation_biopsy_breast | |
| negative | 49 (27.2%) |
| positive | 131 (72.8%) |
| HER2_Interpreation_biopsy_breast | |
| negative | 162 (90.0%) |
| positive | 13 (7.2%) |
| Missing | 5 (2.8%) |
| radiotherapy_primary | |
| no | 146 (81.1%) |
| yes | 31 (17.2%) |
| Missing | 3 (1.7%) |
| radiotherapy_1st_line_metastatic | |
| no | 130 (72.2%) |
| yes | 48 (26.7%) |
| Missing | 2 (1.1%) |
| meta_brain_nonleptomeningeal_first_metastases | |
| no | 176 (97.8%) |
| yes | 2 (1.1%) |
| Missing | 2 (1.1%) |
| meta_leptemeningeal_first_metastases | |
| no | 178 (98.9%) |
| Missing | 2 (1.1%) |
| meta_bones_first_metastases | |
| no | 41 (22.8%) |
| yes | 138 (76.7%) |
| Missing | 1 (0.6%) |
| meta_skin_first_metastases | |
| no | 161 (89.4%) |
| yes | 19 (10.6%) |
| meta_lungs_first_metastases | |
| no | 170 (94.4%) |
| yes | 9 (5.0%) |
| Missing | 1 (0.6%) |
| meta_liver_first_metastases | |
| no | 155 (86.1%) |
| yes | 24 (13.3%) |
| Missing | 1 (0.6%) |
| meta_abdomen_extrahepatic_first_metastases | |
| no | 133 (73.9%) |
| yes | 46 (25.6%) |
| Missing | 1 (0.6%) |
| meta_reproductive_organs_first_metastases | |
| no | 164 (91.1%) |
| yes | 15 (8.3%) |
| Missing | 1 (0.6%) |
| meta_lymph_nodes_first_metastases | |
| no | 134 (74.4%) |
| yes | 46 (25.6%) |
| meta_other_first_metastases | |
| no | 145 (80.6%) |
| yes: adrenal | 4 (2.2%) |
| yes: adrenals | 1 (0.6%) |
| yes: bladder, pleura, retroperitoneum, muscle, mediastinum, pericard | 1 (0.6%) |
| yes: bone marrow | 7 (3.9%) |
| yes: eye | 1 (0.6%) |
| yes: muscle | 2 (1.1%) |
| yes: musle, bone marrow | 1 (0.6%) |
| yes: orbita | 2 (1.1%) |
| yes: orbita, bone marrow, pleura | 1 (0.6%) |
| yes: pleura | 10 (5.6%) |
| yes: pleura, mediastinum | 1 (0.6%) |
| yes: pleura, muscle | 1 (0.6%) |
| yes: pleura, thyroid | 1 (0.6%) |
| yes: thyroid | 1 (0.6%) |
| Missing | 1 (0.6%) |
3.0.4 Number of events
Figure 3.3 describes the event history of the patients. You just need to pick a starting state from the ‘from’ axis and select then transitioning state from the ‘to’ axis. In the corresponding cell, you find the absolute frequency of each transition.
Check the patients with a date of lost to follow-up before date of death
Look at the distribution of the variables through the years
3.0.5 Check patients lost to follow-up before death.
This dotplot shows the distribution of the values of the difference in days between the day of death and the day of last follow-up, for the patients who had a date of last follow-up before the date of death.
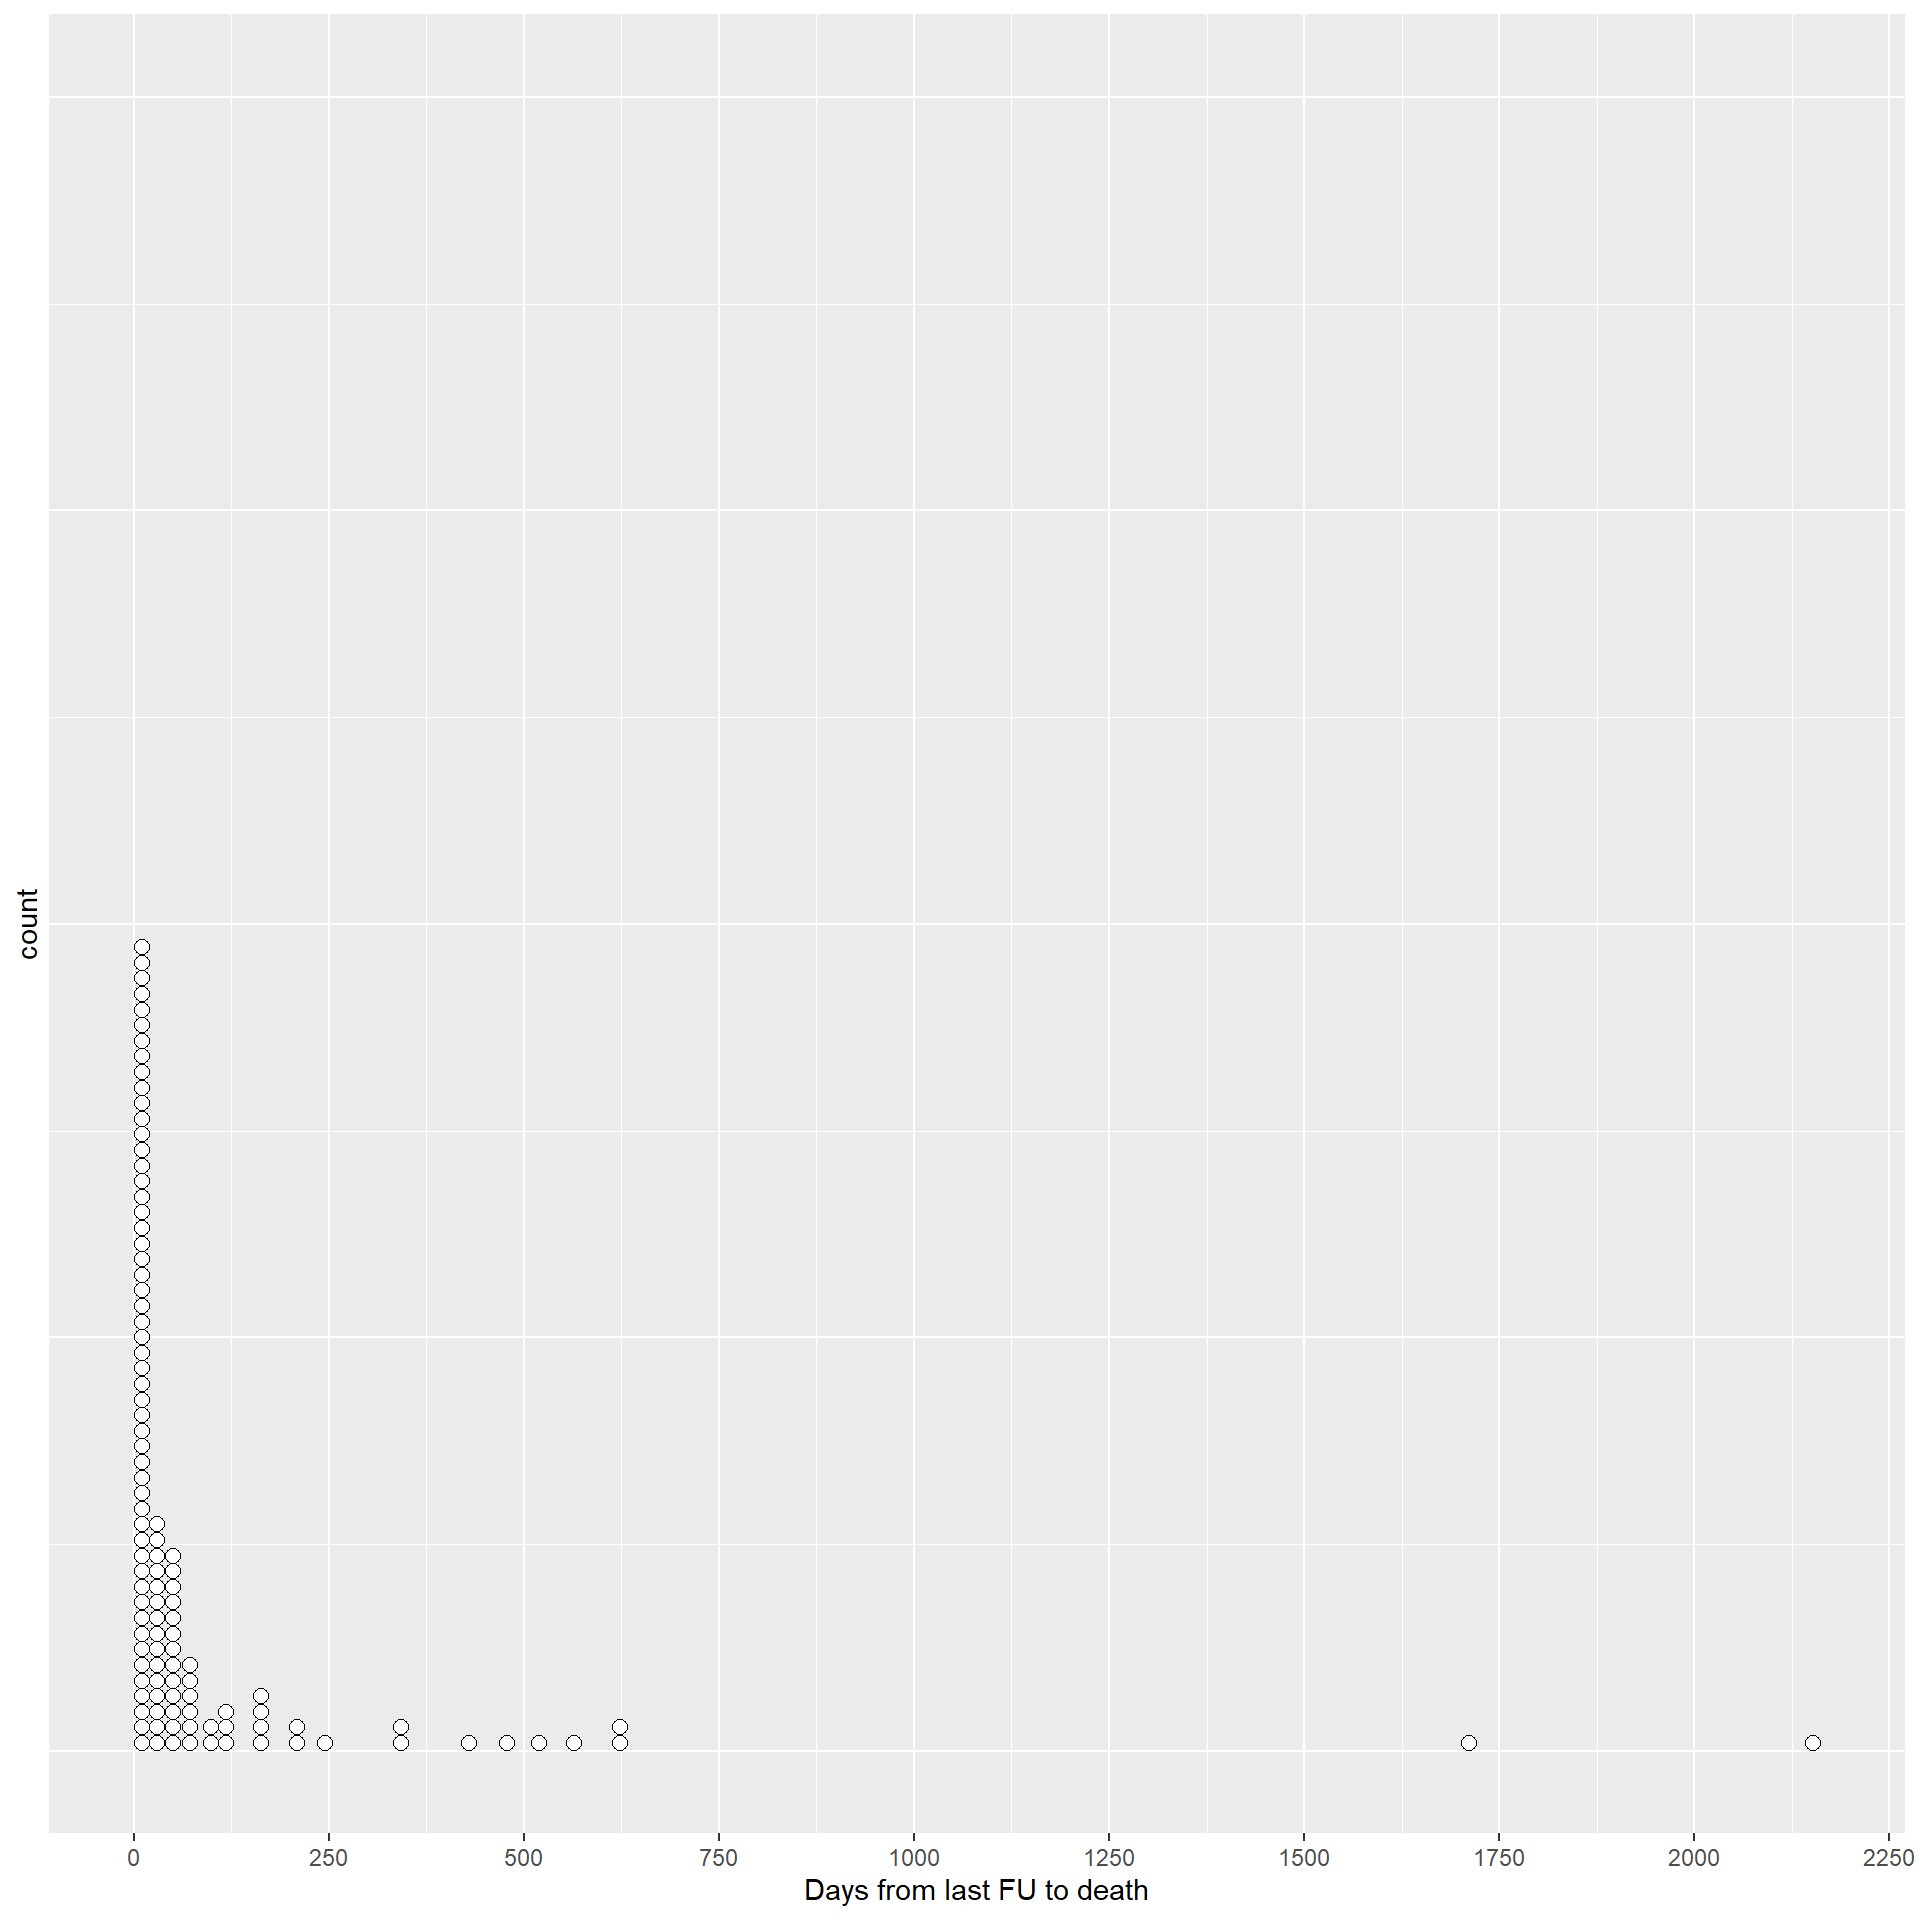
The table reports the patients who died after more than 1 year from their last day of follow-up.