8 Progression-Free Survival Differences
8.1 Event history
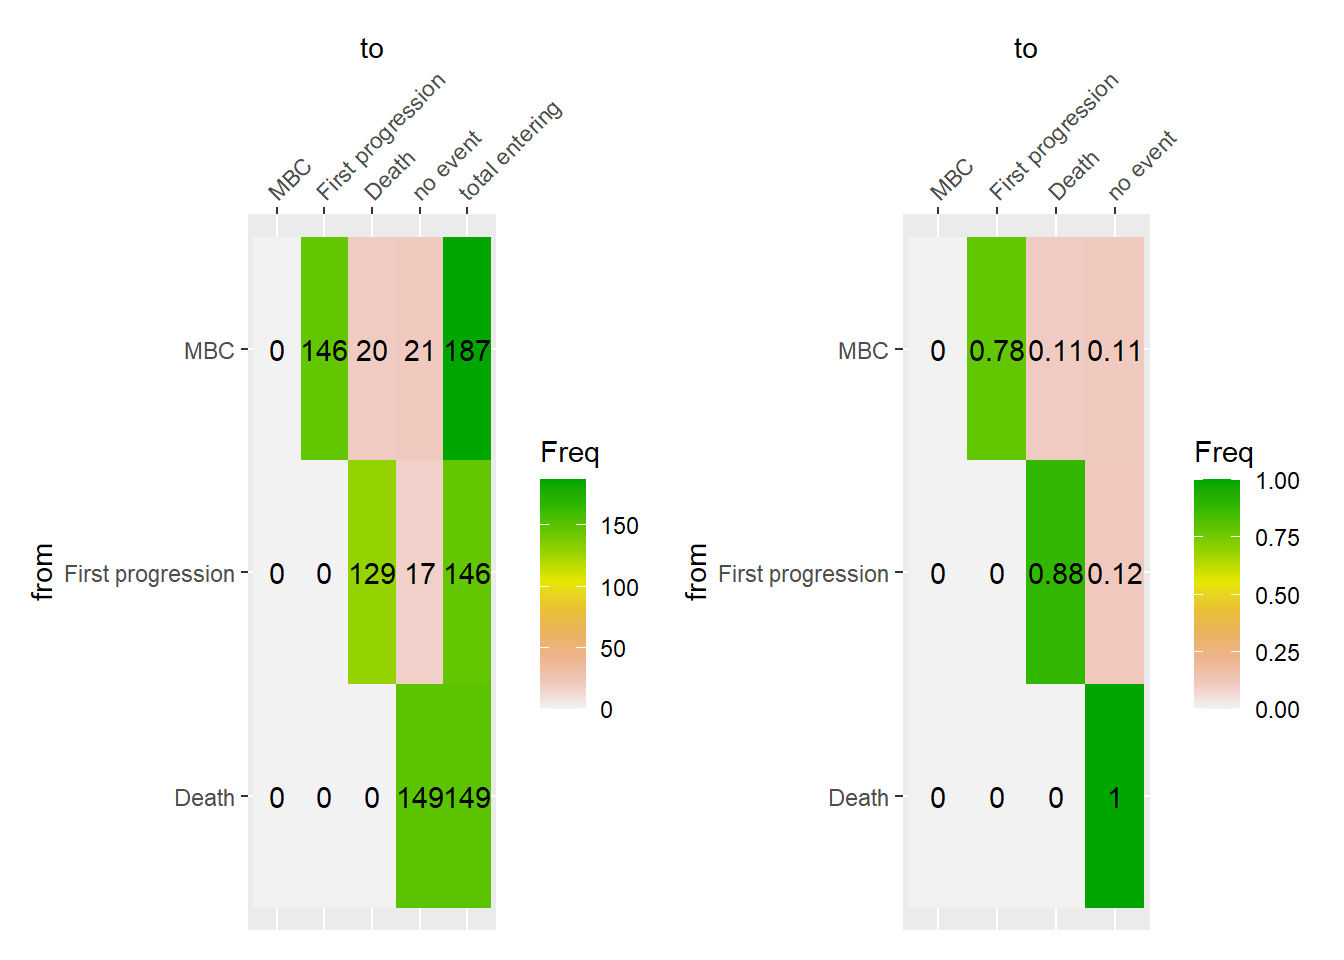
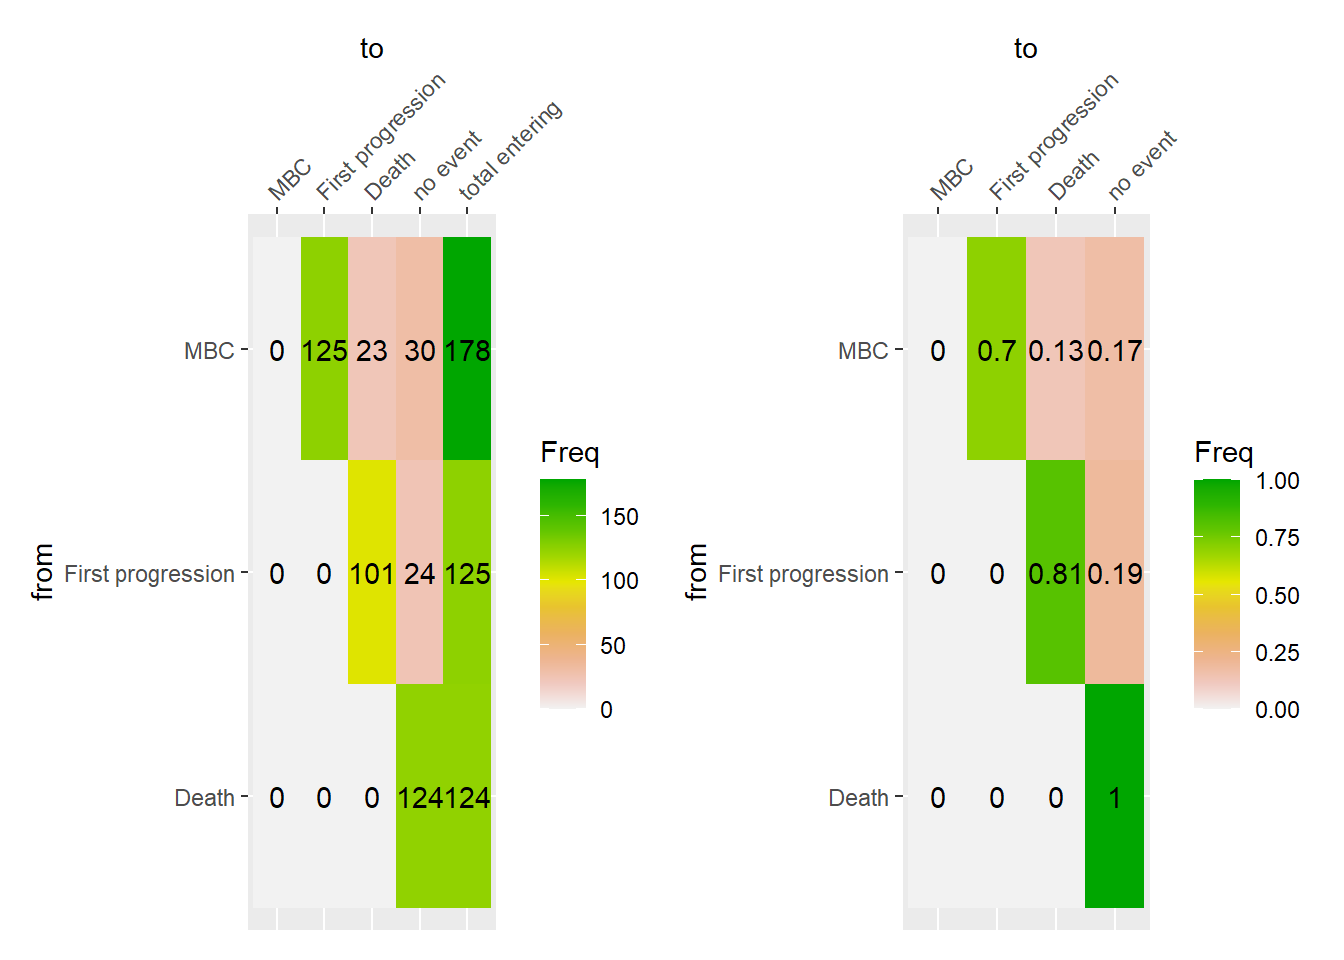
The following figures display the event history of the patients from the start of their metastatic disease to death. The event history is summarized in terms of the absolute frequency and proportion of transition from one state to another.
8.1.1 Event history in M0
8.1.2 Event history in M1
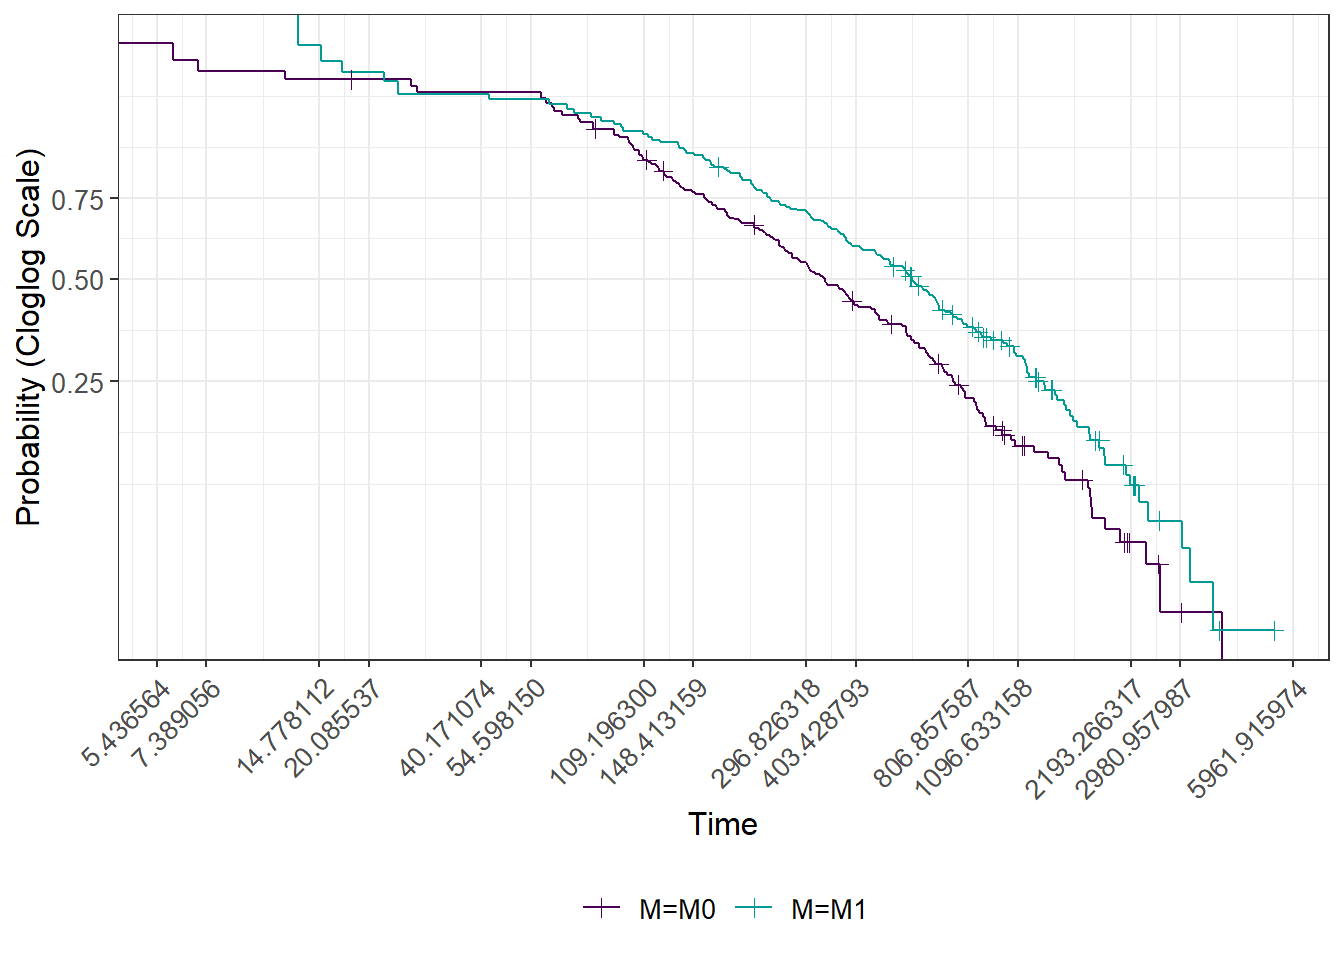
8.2 Marginal analysis
The following analysis describes the marginal association (that is, not adjusted for other confounding prognostic factors) of being M0 vs M1 on the risk of progression (progression free survival time). The association is first visualized by curve separation. 75% of patients have an event between death and progression in 2 years, whereas M1 in 3.5 years. I assessed the possible presence of non-proportional hazards between M0 and M1, adopting a graphical method (plot of the clog-log transformed survival functions vs log of time) and there is not a strong suggestion of non-proportional hazards.
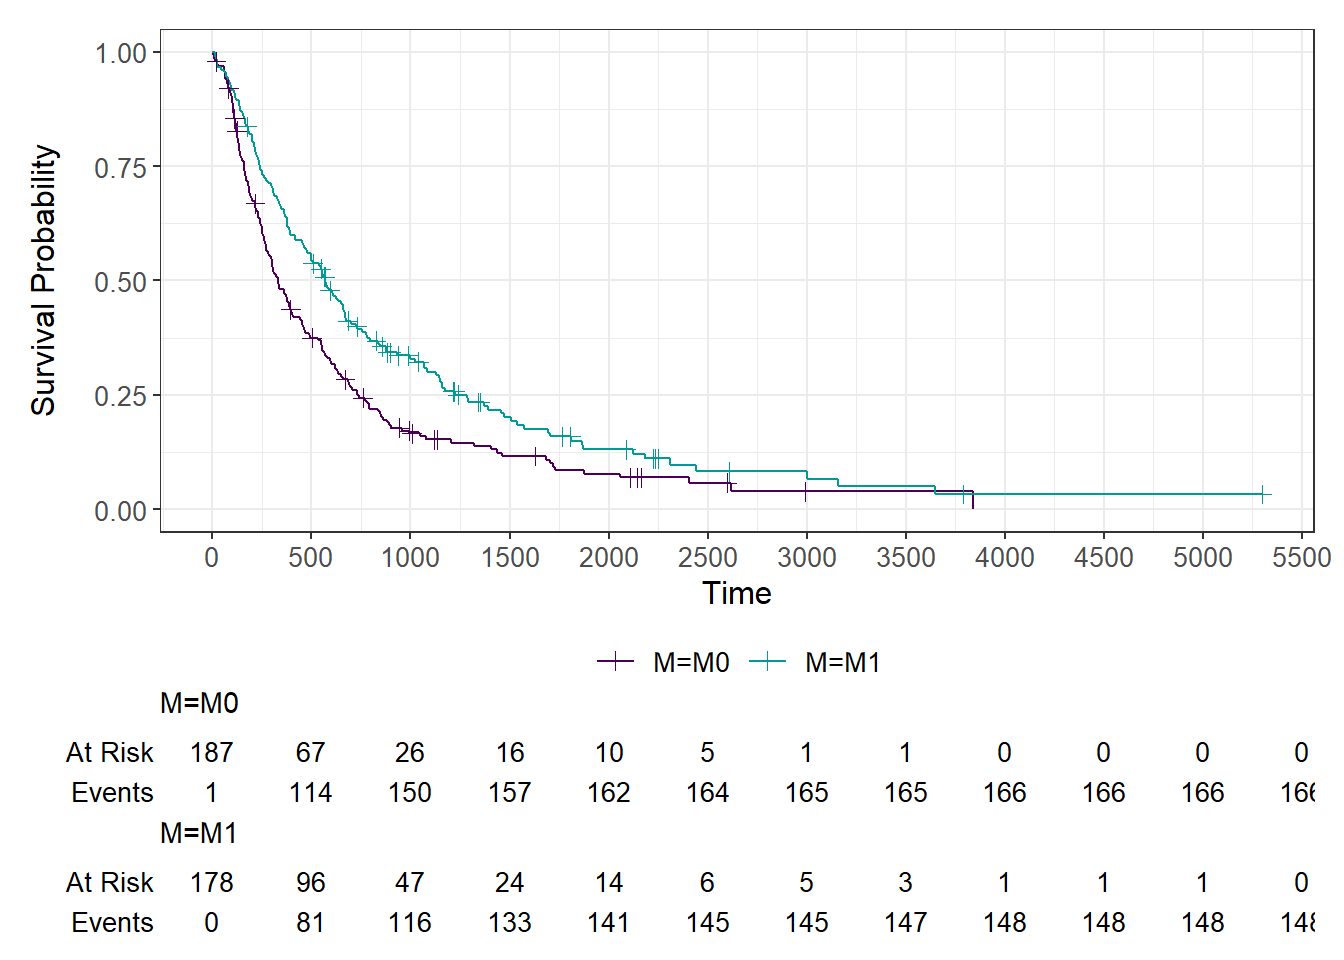
In this setting median follow-up time is computed at the start of the metastatic disease for both M0 and M1. Median follow-up time it is not different between M0 (2597 days) and M1 (2606 days).
Call: survfit(formula = Surv(time_to_death, as.numeric(death_stat ==
    0)) ~ M, data = mod)

       n events median 0.95LCL 0.95UCL
M=M0 187     38   2597    2271      NA
M=M1 178     54   2606    2158    4112
8.3 Adjusted analysis
The following analysis was performed to assess whether the prognostic association of being dnM1 vs rM0 was caused by an unbalanced case mix between the two groups or it is maintained even when strong prognostic factors are considered in a model. For the moment we assessed the prognostic association with a cox proportional hazard model.
The model is structured as follows:
Age (
age): Modeled using restricted cubic splines with 3 knots (rcs(..., 3)).Body Mass Index (
BMI): Also modeled using restricted cubic splines with 3 knots to capture complex, non-linear relationships between body weight and the disease.M: Likely indicates the presence of Distant Metastasis.TNM_cN_at_diagnosis: The clinical Node stage (N) at the time of diagnosis (assessed before surgery).TNM_cT_at_diagnosis: The clinical Tumor stage (T = size/extent of the primary tumor) at the time of diagnosis.hypertension: Presence of high blood pressure.hyperlipidemia: Presence of high cholesterol or triglycerides.Ty2D: Type 2 Diabetes.pregnancy_P: A factor related to Pregnancy (could indicate pregnancy-associated breast cancer).smoking: Smoking status.hormone_replacement: Use of Hormone Replacement Therapy (HRT).Anti_HER2: Targeted biological therapy against the HER2 receptor (e.g., Trastuzumab).CT: Chemotherapy.ET: Endocrine Therapy (Hormone therapy).CDK4_6i: CDK4/6 Inhibitors (a class of targeted drugs, e.g., Palbociclib, Ribociclib).
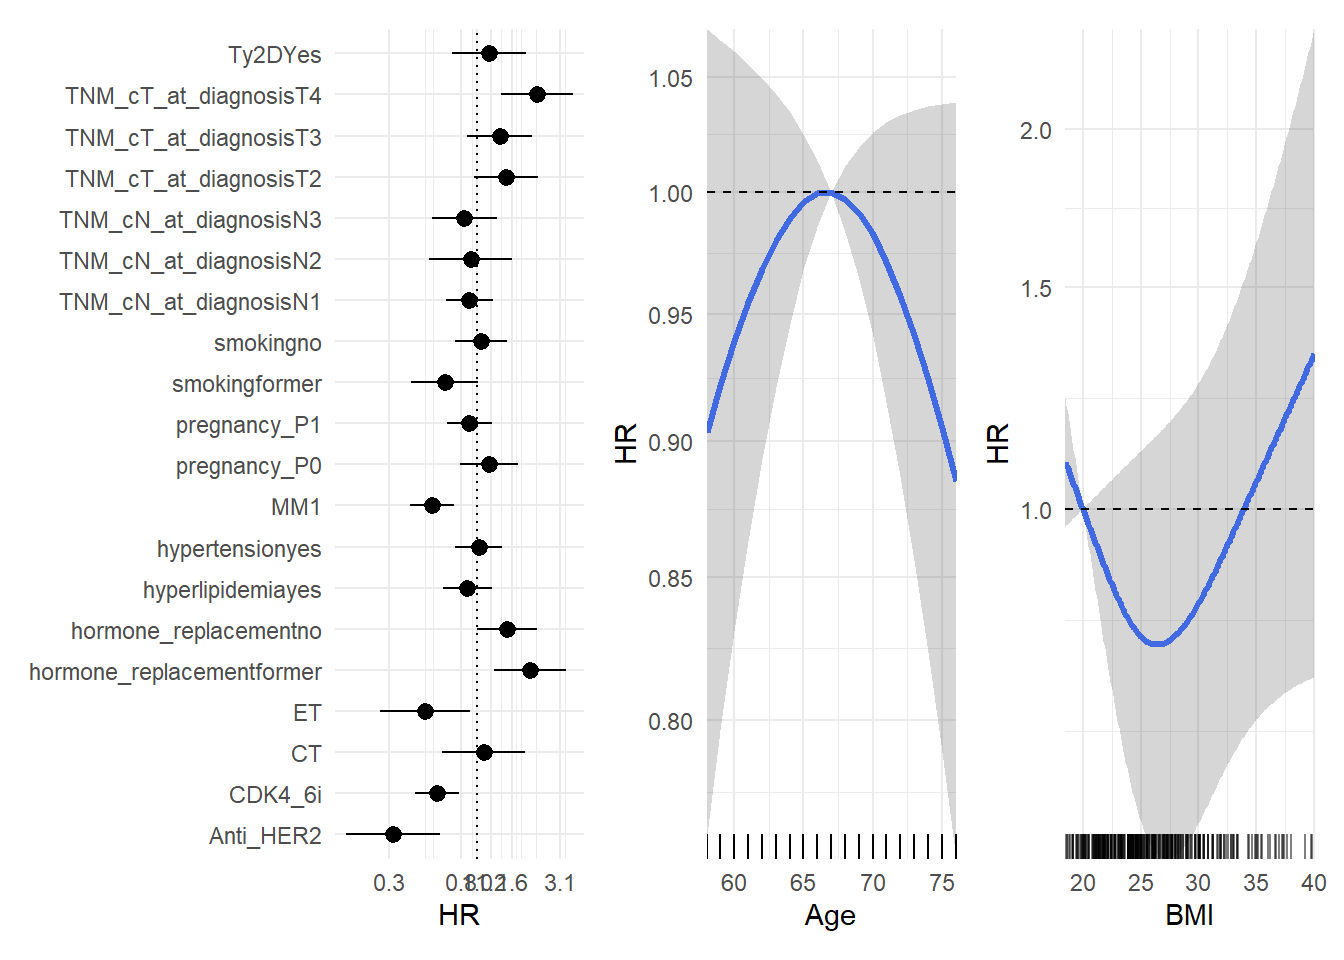
Model results are displayed in a forest plot for categorical factors and non-linear effect plot for continuous BMI and age.
           Anti-HER2                   CT       CT + Anti-HER2
                   1                   14                    4
             CT + ET  CT + ET + Anti-HER2    CT + ET + CDK4/6i
                   7                    5                    4
          CT + Other                   ET         ET + CDK4/6i
                   2                   79                   49
ET + CDK4/6i + Other           ET + Other                Other
                   1                    3                    1
Call:
coxph(formula = Surv(pfst, pfst_status) ~ M + rcs(age, 3) + rcs(BMI,
3) + TNM_cN_at_diagnosis + TNM_cT_at_diagnosis + hypertension +
hyperlipidemia + pregnancy_P + smoking + hormone_replacement +
Ty2D + Anti_HER2 + CT + ET + CDK4_6i, data = mod)
n= 302, number of events= 257
(63 observations deleted due to missingness)
coef exp(coef) se(coef) z Pr(>|z|)
MM1 -0.61413 0.54111 0.15362 -3.998 6.4e-05 ***
rcs(age, 3)age 0.02599 1.02633 0.01558 1.668 0.095324 .
rcs(age, 3)age' -0.03618 0.96447 0.01792 -2.019 0.043439 *
rcs(BMI, 3)BMI -0.05688 0.94471 0.04000 -1.422 0.154995
rcs(BMI, 3)BMI' 0.08634 1.09018 0.04976 1.735 0.082694 .
TNM_cN_at_diagnosisN1 -0.10606 0.89937 0.16188 -0.655 0.512344
TNM_cN_at_diagnosisN2 -0.08939 0.91449 0.28756 -0.311 0.755920
TNM_cN_at_diagnosisN3 -0.17838 0.83662 0.22611 -0.789 0.430151
TNM_cT_at_diagnosisT2 0.39973 1.49142 0.22307 1.792 0.073145 .
TNM_cT_at_diagnosisT3 0.30768 1.36026 0.22738 1.353 0.176018
TNM_cT_at_diagnosisT4 0.81261 2.25379 0.25139 3.232 0.001227 **
hypertensionyes 0.02118 1.02141 0.16535 0.128 0.898078
hyperlipidemiayes -0.13342 0.87510 0.17328 -0.770 0.441325
pregnancy_P0 0.16250 1.17645 0.20378 0.797 0.425192
pregnancy_P1 -0.10704 0.89849 0.15870 -0.675 0.499990
smokingformer -0.44571 0.64037 0.23508 -1.896 0.057966 .
smokingno 0.05474 1.05627 0.18180 0.301 0.763328
hormone_replacementformer 0.72296 2.06052 0.24919 2.901 0.003717 **
hormone_replacementno 0.40754 1.50311 0.20729 1.966 0.049293 *
Ty2DYes 0.16035 1.17392 0.25791 0.622 0.534119
Anti_HER2 -1.15313 0.31565 0.32621 -3.535 0.000408 ***
CT 0.08739 1.09133 0.28742 0.304 0.761079
ET -0.71137 0.49097 0.31519 -2.257 0.024011 *
CDK4_6i -0.55045 0.57669 0.15355 -3.585 0.000337 ***
---
Signif. codes: 0 '***' 0.001 '**' 0.01 '*' 0.05 '.' 0.1 ' ' 1
exp(coef) exp(-coef) lower .95 upper .95
MM1 0.5411 1.8480 0.4004 0.7312
rcs(age, 3)age 1.0263 0.9743 0.9955 1.0582
rcs(age, 3)age' 0.9645 1.0368 0.9312 0.9989
rcs(BMI, 3)BMI 0.9447 1.0585 0.8735 1.0217
rcs(BMI, 3)BMI' 1.0902 0.9173 0.9889 1.2018
TNM_cN_at_diagnosisN1 0.8994 1.1119 0.6549 1.2352
TNM_cN_at_diagnosisN2 0.9145 1.0935 0.5205 1.6068
TNM_cN_at_diagnosisN3 0.8366 1.1953 0.5371 1.3031
TNM_cT_at_diagnosisT2 1.4914 0.6705 0.9632 2.3093
TNM_cT_at_diagnosisT3 1.3603 0.7352 0.8711 2.1241
TNM_cT_at_diagnosisT4 2.2538 0.4437 1.3770 3.6889
hypertensionyes 1.0214 0.9790 0.7387 1.4124
hyperlipidemiayes 0.8751 1.1427 0.6231 1.2290
pregnancy_P0 1.1765 0.8500 0.7891 1.7540
pregnancy_P1 0.8985 1.1130 0.6583 1.2263
smokingformer 0.6404 1.5616 0.4039 1.0152
smokingno 1.0563 0.9467 0.7396 1.5084
hormone_replacementformer 2.0605 0.4853 1.2643 3.3581
hormone_replacementno 1.5031 0.6653 1.0013 2.2565
Ty2DYes 1.1739 0.8518 0.7081 1.9461
Anti_HER2 0.3156 3.1681 0.1665 0.5982
CT 1.0913 0.9163 0.6213 1.9169
ET 0.4910 2.0368 0.2647 0.9106
CDK4_6i 0.5767 1.7340 0.4268 0.7792
Concordance= 0.677 (se = 0.017 )
Likelihood ratio test= 75.28 on 24 df, p=3e-07
Wald test = 72.19 on 24 df, p=1e-06
Score (logrank) test = 74.37 on 24 df, p=5e-07