[1] "positive positive" "negative negative" "positive negative"[1] <NA> negative positive
Levels: negative positive
    HER2+ HR+/HER2-      TNBC
13 148 14 I proceed with the second task. The new files I loaded are the following: L:\\GBW-0080_BC_Lab\\Data\\FAT-ILC\\Giacomo\\ILCdatabaseM0_cleaned0312.xls and L:\\GBW-0080_BC_Lab\\Data\\FAT-ILC\\Giacomo\\ILCdatabaseM1 20251209.xlsx.
I select the variables considered in the preview reports. The variable for M0 are patient_ID, method_of_detection, age_at_diagnosis, age_category, BMI, BMI_category, menopausal_status, smoking, alcohol_abuse, hypertension, hyperlipidemia, diabetes, oral_anticonceptive_use, pregnancy_P, hormone_replacement, familial_history_breast_ovary, visible_on_mammogram, TNM_cT_at_diagnosis, TNM_cN_at_diagnosis, neo_adjuvant_therapy, surgery_type_breast, surgery_type_axilla, TNM_pT_resection_specimen, TNM_pN_resection_specimen, diameter_pathology_resection_specimen, tumor_grade_resection_specimen, resection_margin_resection_specimen, ER_Interpretation, PR_Interpretation, HER2_Interpretation, presence_DCIS_resection_specimen, presence_LCIS_resection_specimen, radiotherapy, adjuvant_chemotherapy, adjuvant_HER2, adjuvant_endocrinetherapy, germline_mutation_testing_performed, germline_mutation_testing_result,germline_mutation_testing_year_most_recent_test, multifocality1
whereas for M1 are patient_ID, method_of_detection, age_at_diagnosis (y), age_category, BMI, BMI_category, menopausal_status, oral_anticonceptive_use,hormone_replacement, smoking, alcohol_abuse, hypertension, hyperlipidemia, diabetes, pregnancy_P, germline_mutation_testing_performed, germline_mutation_testing_result, germline_mutation_testing_year, familial_history_breast_ovary, visible_on_mammogram, TNM_cT_at_diagnosis, TNM_cN_at_diagnosis, tumor_grade_biopsy_breast, ER_Interpretation_biopsy_breast, PR_Interpretation_biopsy_breast, HER2_Interpreation_biopsy_breast,radiotherapy_primary, radiotherapy_1st_line_metastatic, meta_brain_nonleptomeningeal_first_metastases, meta_leptemeningeal_first_metastases, meta_bones_first_metastases, meta_skin_first_metastases, meta_lungs_first_metastases, meta_liver_first_metastases, meta_abdomen_extrahepatic_first_metastases, meta_reproductive_organs_first_metastases, meta_lymph_nodes_first_metastases, meta_other_first_metastases.
Load M0
Load M1
[1] "positive positive" "negative negative" "positive negative"[1] <NA> negative positive
Levels: negative positive
HER2+ HR+/HER2- TNBC
13 148 14 The variables not shared between the two files are age_at_diagnosis, neo_adjuvant_therapy, surgery_type_breast, surgery_type_axilla, TNM_pT_resection_specimen, TNM_pN_resection_specimen, diameter_pathology_resection_specimen, tumor_grade_resection_specimen, resection_margin_resection_specimen, ER_Interpretation, PR_Interpretation, HER2_Interpretation, presence_DCIS_resection_specimen, presence_LCIS_resection_specimen, radiotherapy, adjuvant_chemotherapy, adjuvant_HER2, adjuvant_endocrinetherapy, germline_mutation_testing_year_most_recent_test, multifocality.
The following variables are absent for M1 patients: neo_adjuvant_therapy, surgery_type_breast, surgery_type_axilla, TNM_pT_resection_specimen, TNM_pN_resection_specimen, diameter_pathology_resection_specimen, tumor_grade_resection_specimen, resection_margin_resection_specimen, presence_DCIS_resection_specimen, presence_LCIS_resection_specimen, adjuvant_chemotherapy, adjuvant_HER2, adjuvant_endocrinetherapy, multifocality. I homogenized the BMI categories in Underweight, Normalweight, Overweight, Obese. I created categories for pregnancy_P (0, 1, >1), and also categories for Diabetes (Ty2D, NoTy2D, Missing). There is one patient in M1 that has Diabetes but her type is not specified. for the moment she results with a missing value for that. It follows a brief description between M0 and M1 for the variables patient_ID, method_of_detection, age_at_diagnosis, age_category, BMI, BMI_category, menopausal_status, smoking, alcohol_abuse, hypertension, hyperlipidemia, diabetes, oral_anticonceptive_use, pregnancy_P, hormone_replacement, familial_history_breast_ovary, visible_on_mammogram, TNM_cT_at_diagnosis, TNM_cN_at_diagnosis, radiotherapy, germline_mutation_testing_performed, germline_mutation_testing_result, germline_mutation_testing_year_most_recent_test, HR, subty
| M0 (N=1367) |
M1 (N=180) |
Overall (N=1547) |
|
|---|---|---|---|
| method_of_detection | |||
| radiologically detected | 548 (40.1%) | 19 (10.6%) | 567 (36.7%) |
| symptoms | 774 (56.6%) | 159 (88.3%) | 933 (60.3%) |
| Missing | 45 (3.3%) | 2 (1.1%) | 47 (3.0%) |
| age_at_diagnosis | |||
| Mean (SD) | 61.5 (11.8) | 66.3 (12.4) | 62.0 (12.0) |
| Median [Min, Max] | 61.0 [32.0, 95.0] | 67.0 [33.0, 92.0] | 62.0 [32.0, 95.0] |
| age_category | |||
| < 40 | 23 (1.7%) | 4 (2.2%) | 27 (1.7%) |
| 40 - 49 | 210 (15.4%) | 12 (6.7%) | 222 (14.4%) |
| 50 - 59 | 387 (28.3%) | 39 (21.7%) | 426 (27.5%) |
| 60 - 69 | 397 (29.0%) | 50 (27.8%) | 447 (28.9%) |
| 70 - 79 | 244 (17.8%) | 44 (24.4%) | 288 (18.6%) |
| ≥ 80 | 106 (7.8%) | 31 (17.2%) | 137 (8.9%) |
| BMI | |||
| Mean (SD) | 25.6 (4.85) | 26.4 (5.22) | 25.7 (4.89) |
| Median [Min, Max] | 24.8 [14.9, 47.7] | 25.7 [18.4, 41.6] | 24.9 [14.9, 47.7] |
| Missing | 17 (1.2%) | 17 (9.4%) | 34 (2.2%) |
| BMI_category | |||
| Underweight | 29 (2.1%) | 3 (1.7%) | 32 (2.1%) |
| Normalweight | 675 (49.4%) | 68 (37.8%) | 743 (48.0%) |
| Overweight | 424 (31.0%) | 56 (31.1%) | 480 (31.0%) |
| Obese | 222 (16.2%) | 36 (20.0%) | 258 (16.7%) |
| Missing | 17 (1.2%) | 17 (9.4%) | 34 (2.2%) |
| menopausal_status | |||
| Postmenopausal | 981 (71.8%) | 149 (82.8%) | 1130 (73.0%) |
| pre- and perimenopausal | 344 (25.2%) | 31 (17.2%) | 375 (24.2%) |
| Missing | 42 (3.1%) | 0 (0%) | 42 (2.7%) |
| smoking | |||
| active | 188 (13.8%) | 30 (16.7%) | 218 (14.1%) |
| former | 266 (19.5%) | 20 (11.1%) | 286 (18.5%) |
| no | 912 (66.7%) | 117 (65.0%) | 1029 (66.5%) |
| Missing | 1 (0.1%) | 13 (7.2%) | 14 (0.9%) |
| alcohol_abuse | |||
| no | 1159 (84.8%) | 144 (80.0%) | 1303 (84.2%) |
| yes | 205 (15.0%) | 17 (9.4%) | 222 (14.4%) |
| Missing | 3 (0.2%) | 19 (10.6%) | 22 (1.4%) |
| hypertension | |||
| no | 844 (61.7%) | 96 (53.3%) | 940 (60.8%) |
| yes | 522 (38.2%) | 84 (46.7%) | 606 (39.2%) |
| Missing | 1 (0.1%) | 0 (0%) | 1 (0.1%) |
| hyperlipidemia | |||
| no | 1058 (77.4%) | 124 (68.9%) | 1182 (76.4%) |
| yes | 309 (22.6%) | 56 (31.1%) | 365 (23.6%) |
| Ty2D | |||
| No | 1283 (93.9%) | 156 (86.7%) | 1439 (93.0%) |
| Yes | 80 (5.9%) | 24 (13.3%) | 104 (6.7%) |
| Missing | 4 (0.3%) | 0 (0%) | 4 (0.3%) |
| oral_anticonceptive_use | |||
| active | 181 (13.2%) | 16 (8.9%) | 197 (12.7%) |
| former | 670 (49.0%) | 61 (33.9%) | 731 (47.3%) |
| no | 427 (31.2%) | 43 (23.9%) | 470 (30.4%) |
| Missing | 89 (6.5%) | 60 (33.3%) | 149 (9.6%) |
| pregnancy_P | |||
| >1 | 883 (64.6%) | 98 (54.4%) | 981 (63.4%) |
| 0 | 188 (13.8%) | 23 (12.8%) | 211 (13.6%) |
| 1 | 293 (21.4%) | 50 (27.8%) | 343 (22.2%) |
| Missing | 3 (0.2%) | 9 (5.0%) | 12 (0.8%) |
| hormone_replacement | |||
| active | 204 (14.9%) | 16 (8.9%) | 220 (14.2%) |
| former | 167 (12.2%) | 24 (13.3%) | 191 (12.3%) |
| no | 940 (68.8%) | 127 (70.6%) | 1067 (69.0%) |
| Missing | 56 (4.1%) | 13 (7.2%) | 69 (4.5%) |
| familial_history_breast_ovary | |||
| no | 825 (60.4%) | 110 (61.1%) | 935 (60.4%) |
| yes | 533 (39.0%) | 55 (30.6%) | 588 (38.0%) |
| Missing | 9 (0.7%) | 15 (8.3%) | 24 (1.6%) |
| visible_on_mammogram | |||
| no | 123 (9.0%) | 17 (9.4%) | 140 (9.0%) |
| yes | 1220 (89.2%) | 133 (73.9%) | 1353 (87.5%) |
| Missing | 24 (1.8%) | 30 (16.7%) | 54 (3.5%) |
| TNM_cT_at_diagnosis | |||
| T1a | 13 (1.0%) | 1 (0.6%) | 14 (0.9%) |
| T1b | 140 (10.2%) | 4 (2.2%) | 144 (9.3%) |
| T1c | 358 (26.2%) | 19 (10.6%) | 377 (24.4%) |
| T1mi | 1 (0.1%) | 0 (0%) | 1 (0.1%) |
| T2 | 594 (43.5%) | 47 (26.1%) | 641 (41.4%) |
| T3 | 193 (14.1%) | 43 (23.9%) | 236 (15.3%) |
| T4a | 3 (0.2%) | 1 (0.6%) | 4 (0.3%) |
| T4b | 37 (2.7%) | 26 (14.4%) | 63 (4.1%) |
| T4c | 2 (0.1%) | 6 (3.3%) | 8 (0.5%) |
| T4d | 10 (0.7%) | 22 (12.2%) | 32 (2.1%) |
| Tis | 10 (0.7%) | 0 (0%) | 10 (0.6%) |
| Tx | 0 (0%) | 7 (3.9%) | 7 (0.5%) |
| Missing | 6 (0.4%) | 4 (2.2%) | 10 (0.6%) |
| TNM_cN_at_diagnosis | |||
| N0 | 1124 (82.2%) | 40 (22.2%) | 1164 (75.2%) |
| N1 | 196 (14.3%) | 57 (31.7%) | 253 (16.4%) |
| N2 | 11 (0.8%) | 19 (10.6%) | 30 (1.9%) |
| N3a | 18 (1.3%) | 15 (8.3%) | 33 (2.1%) |
| N3b | 3 (0.2%) | 11 (6.1%) | 14 (0.9%) |
| N3c | 6 (0.4%) | 31 (17.2%) | 37 (2.4%) |
| N3 | 0 (0%) | 1 (0.6%) | 1 (0.1%) |
| x | 0 (0%) | 1 (0.6%) | 1 (0.1%) |
| Missing | 9 (0.7%) | 5 (2.8%) | 14 (0.9%) |
| subty | |||
| HER2+ | 59 (4.3%) | 13 (7.2%) | 72 (4.7%) |
| HR+/HER2- | 1281 (93.7%) | 148 (82.2%) | 1429 (92.4%) |
| TNBC | 14 (1.0%) | 14 (7.8%) | 28 (1.8%) |
| Missing | 13 (1.0%) | 5 (2.8%) | 18 (1.2%) |
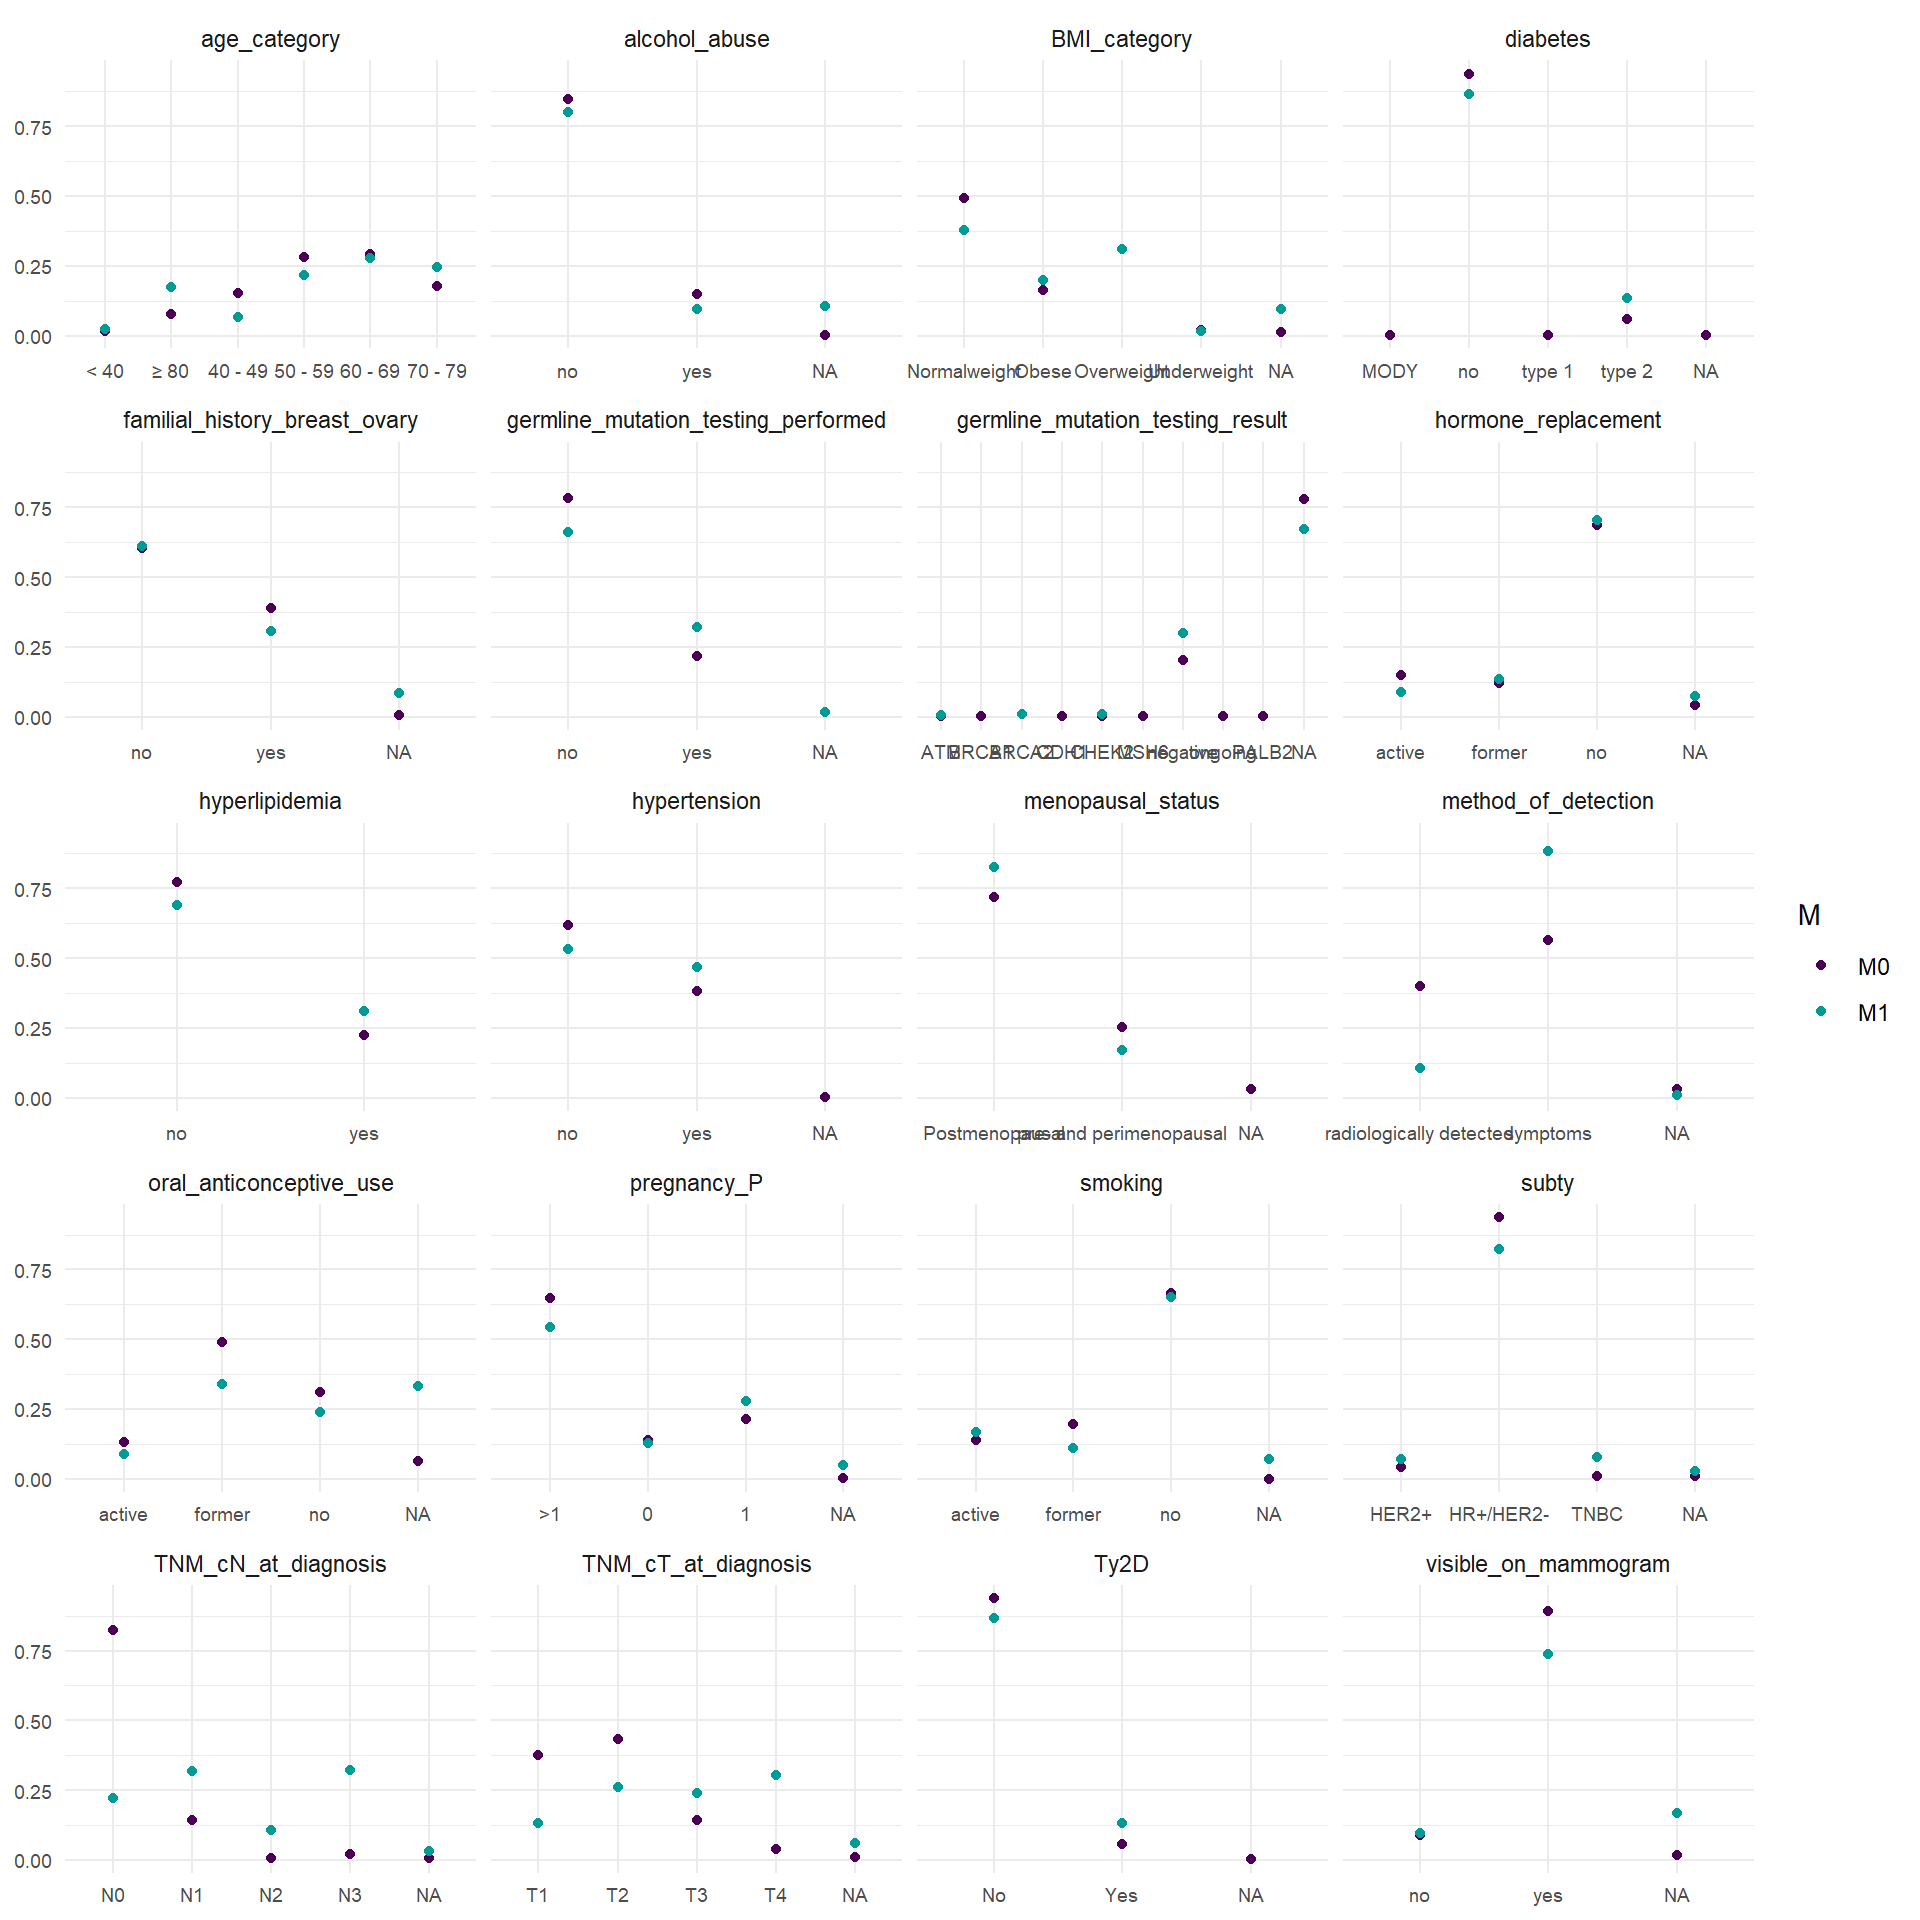
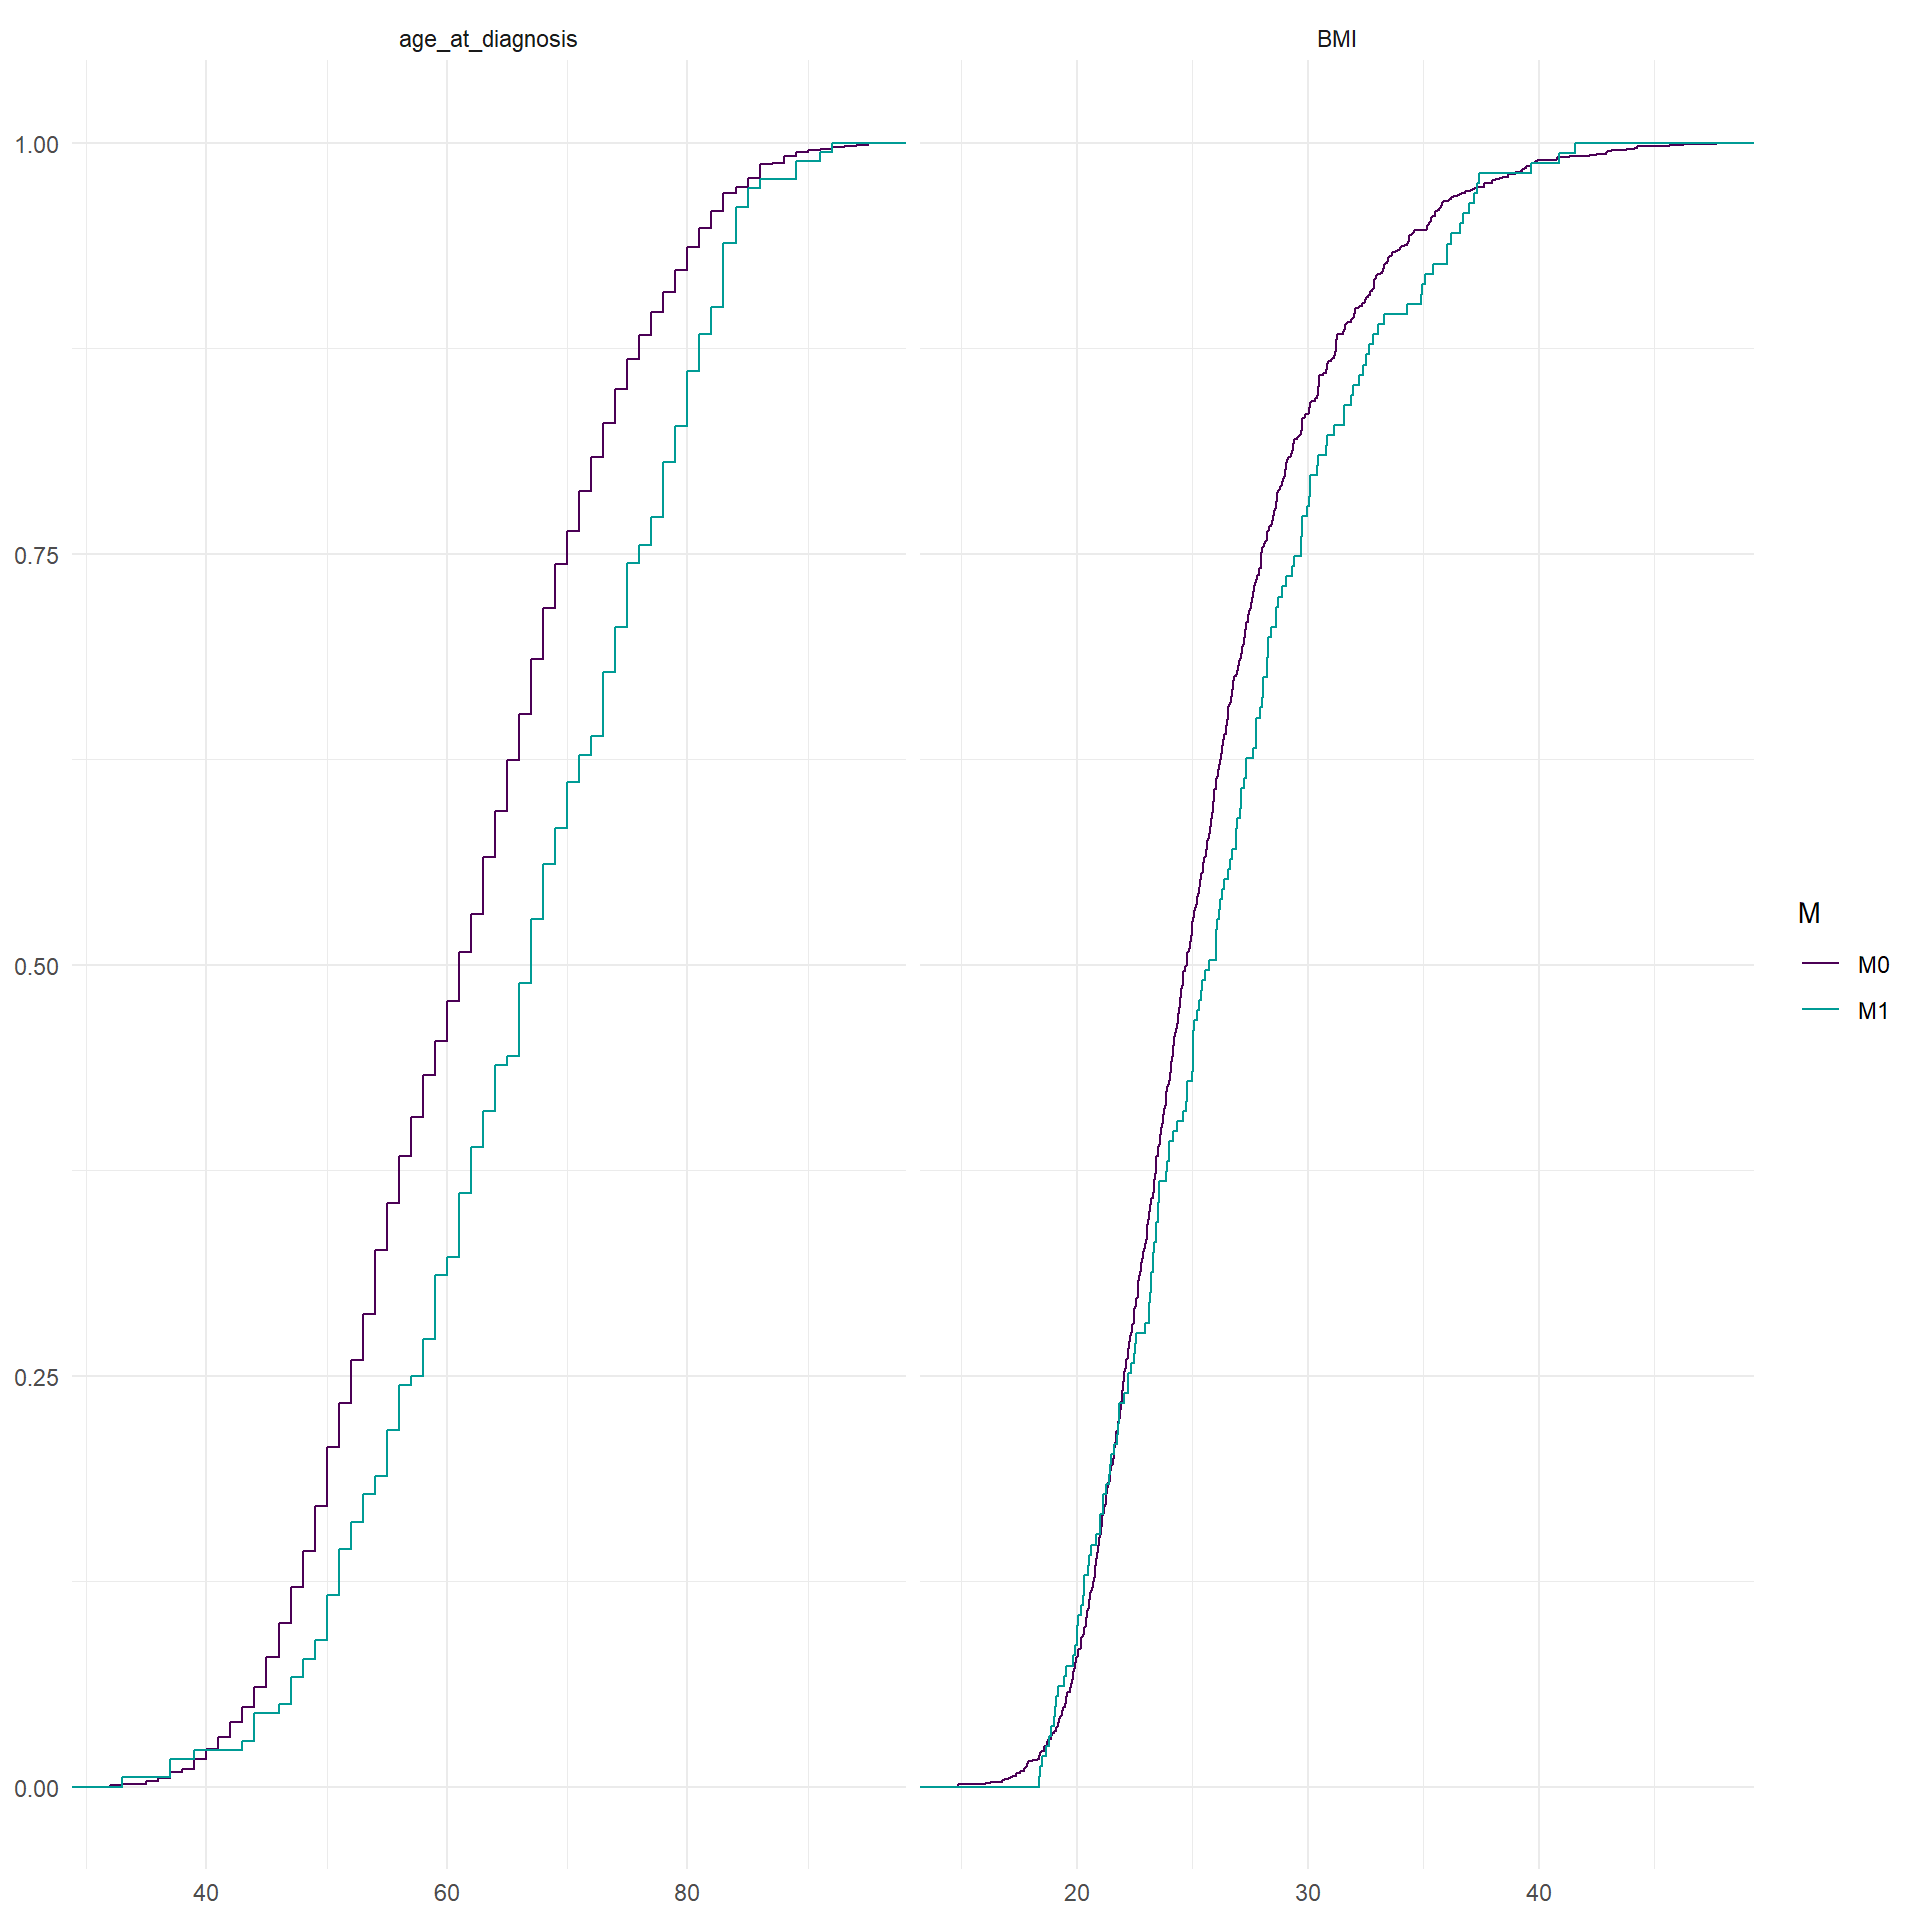
In the following representations, relative frequency of the categories of the categorical variable between M0 and M1 patients are reported. For the continuous covariates, empirical cumulative distribution function stratified by M0 and M1 are reported.
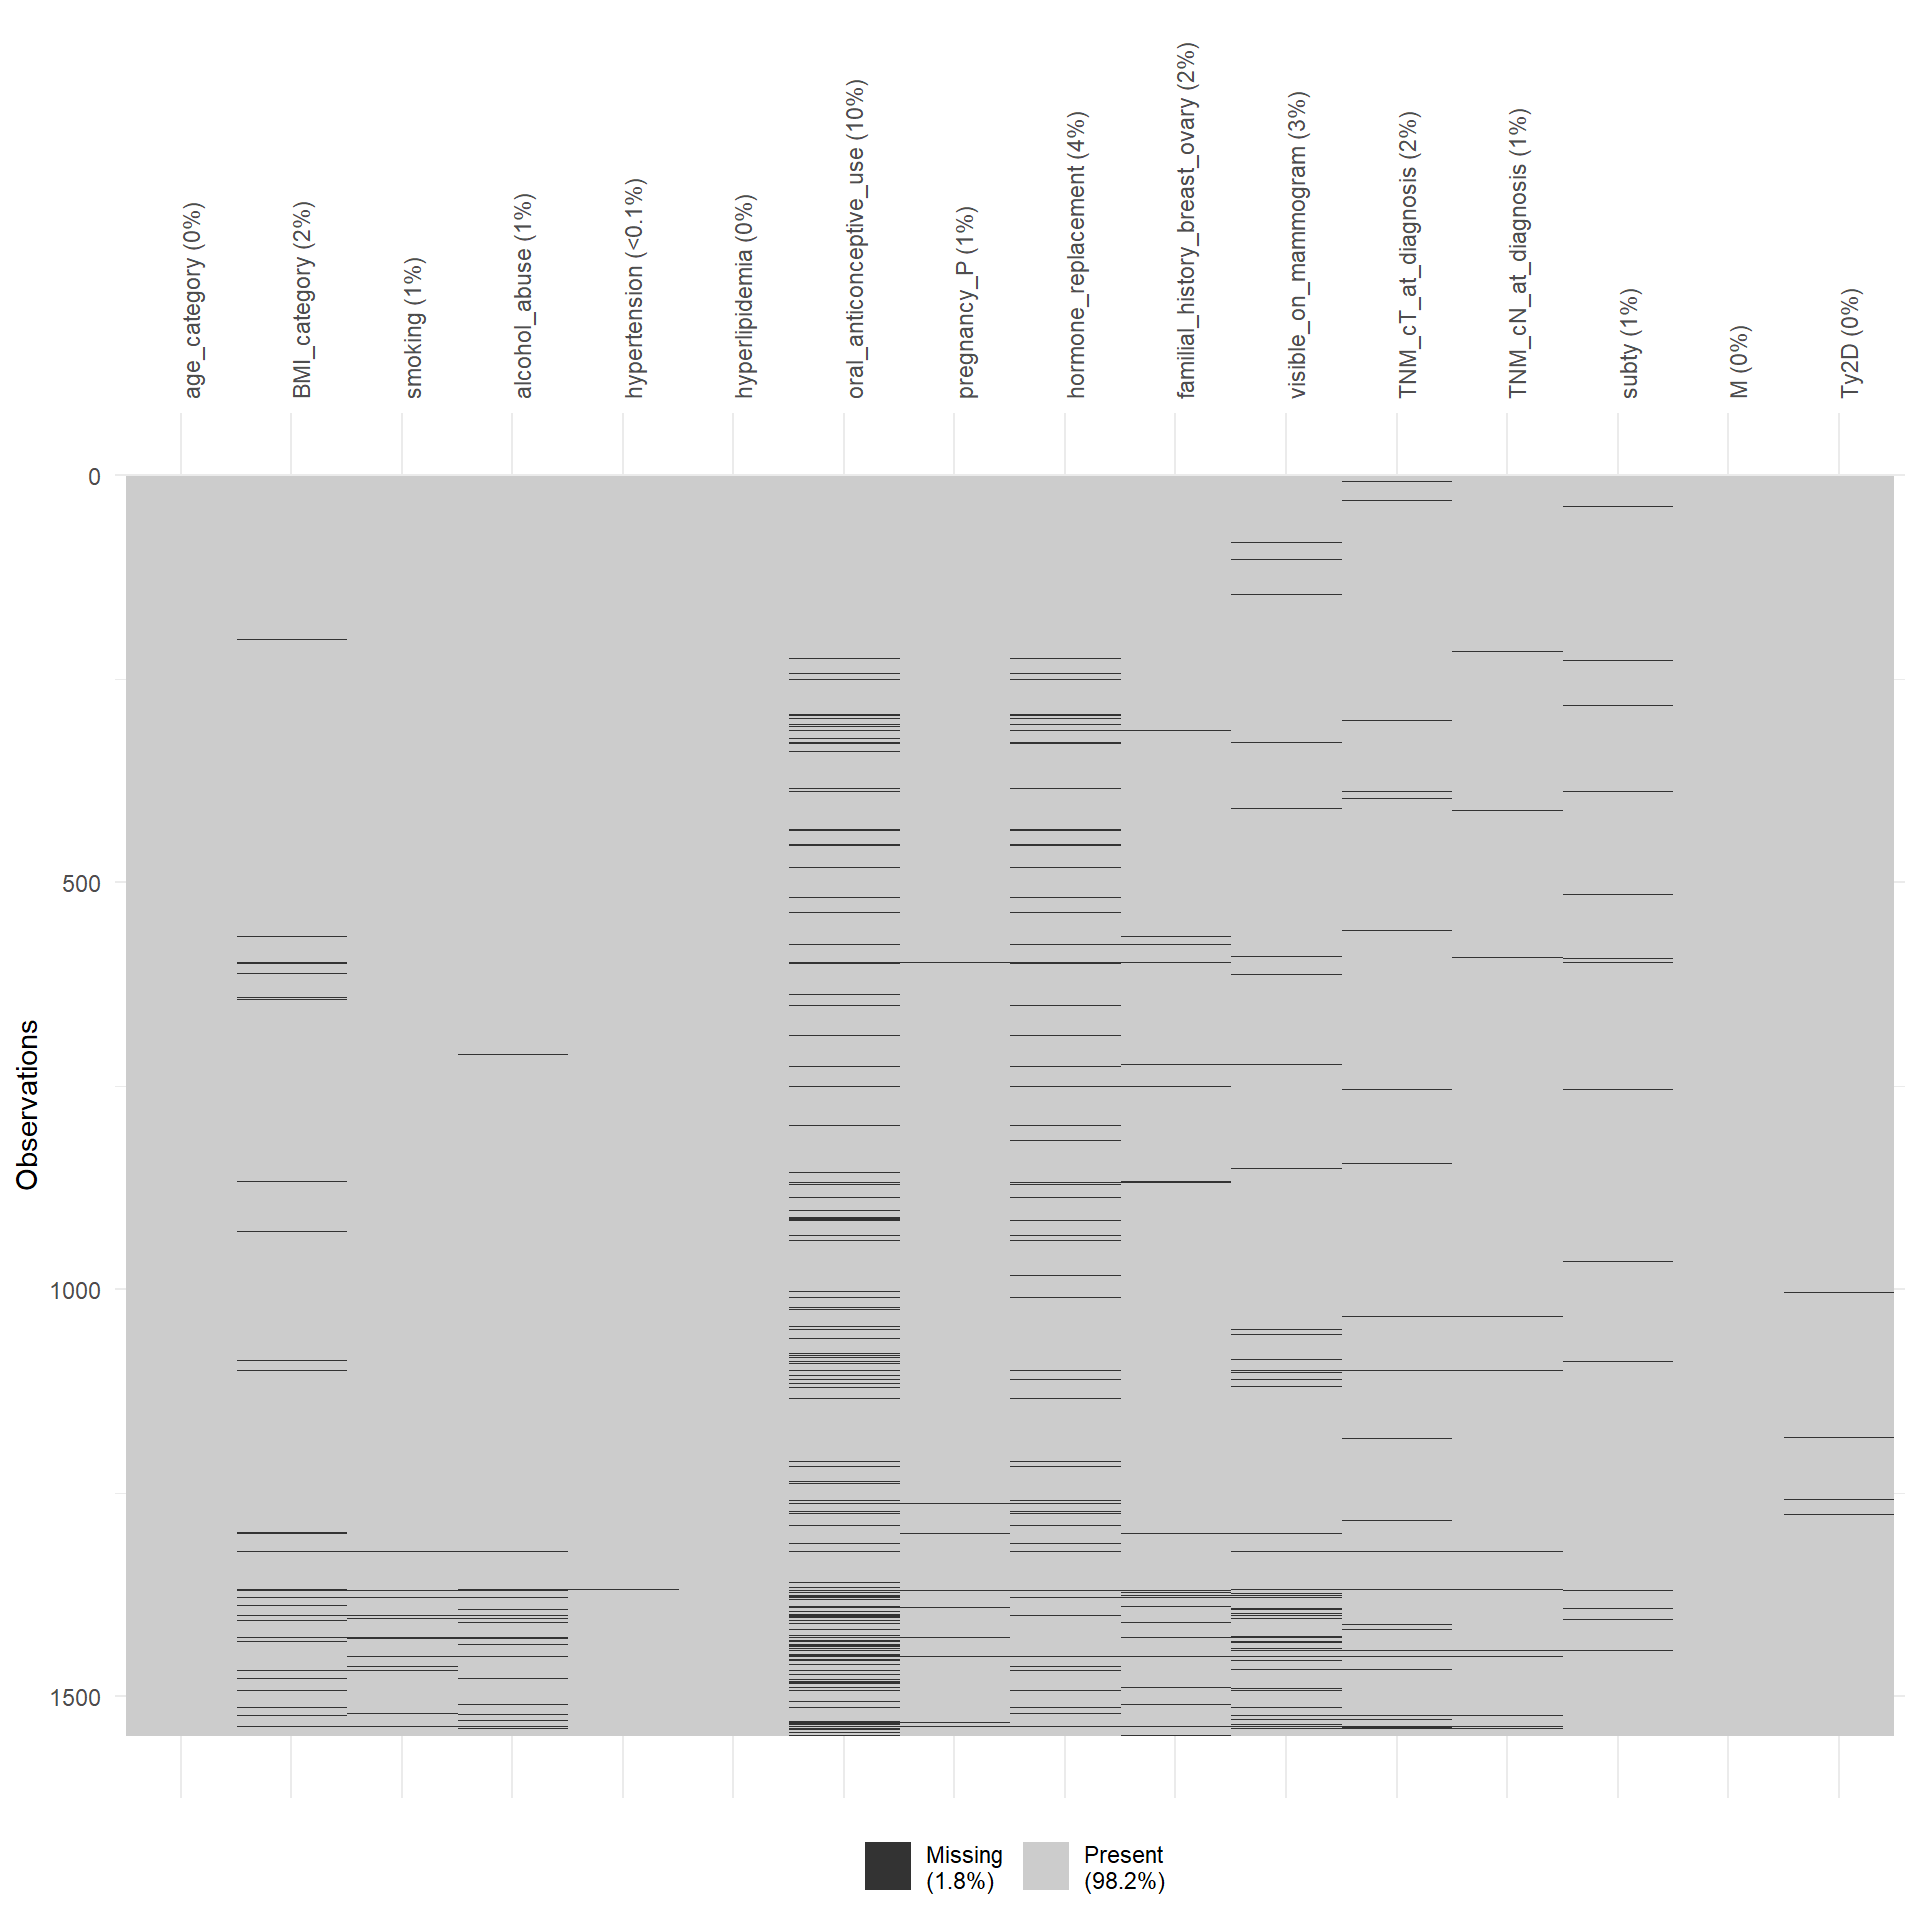
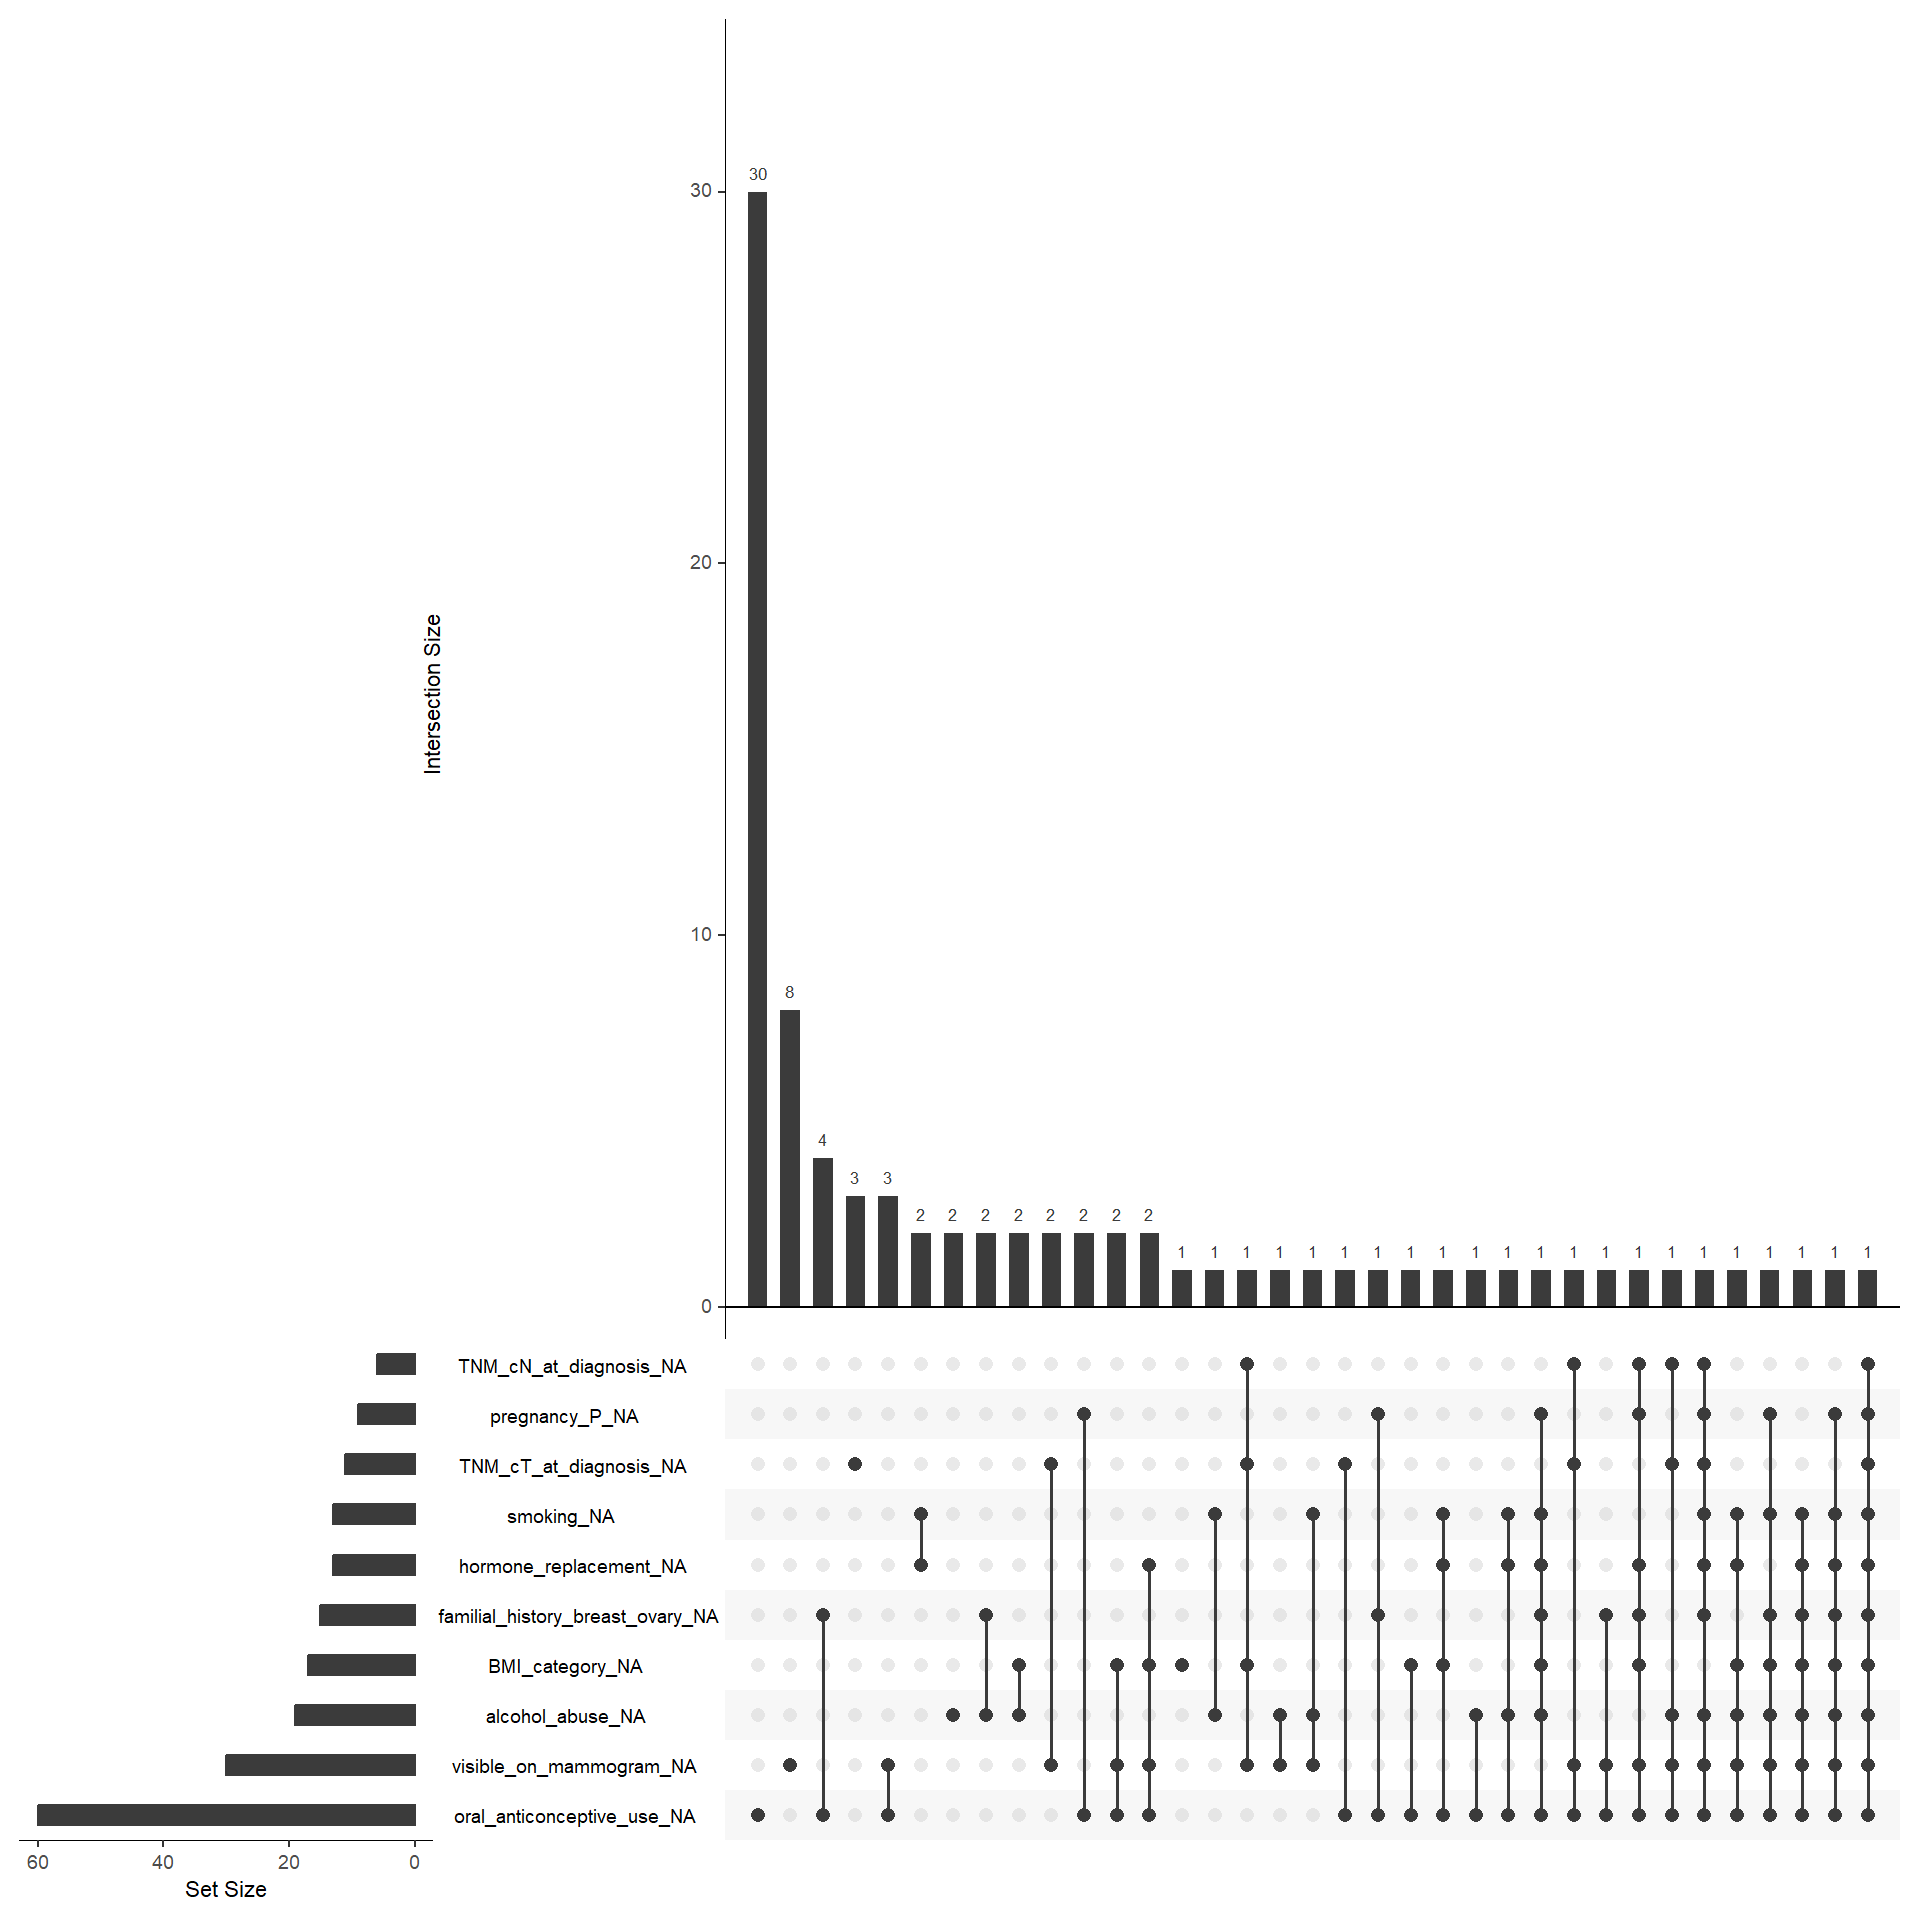
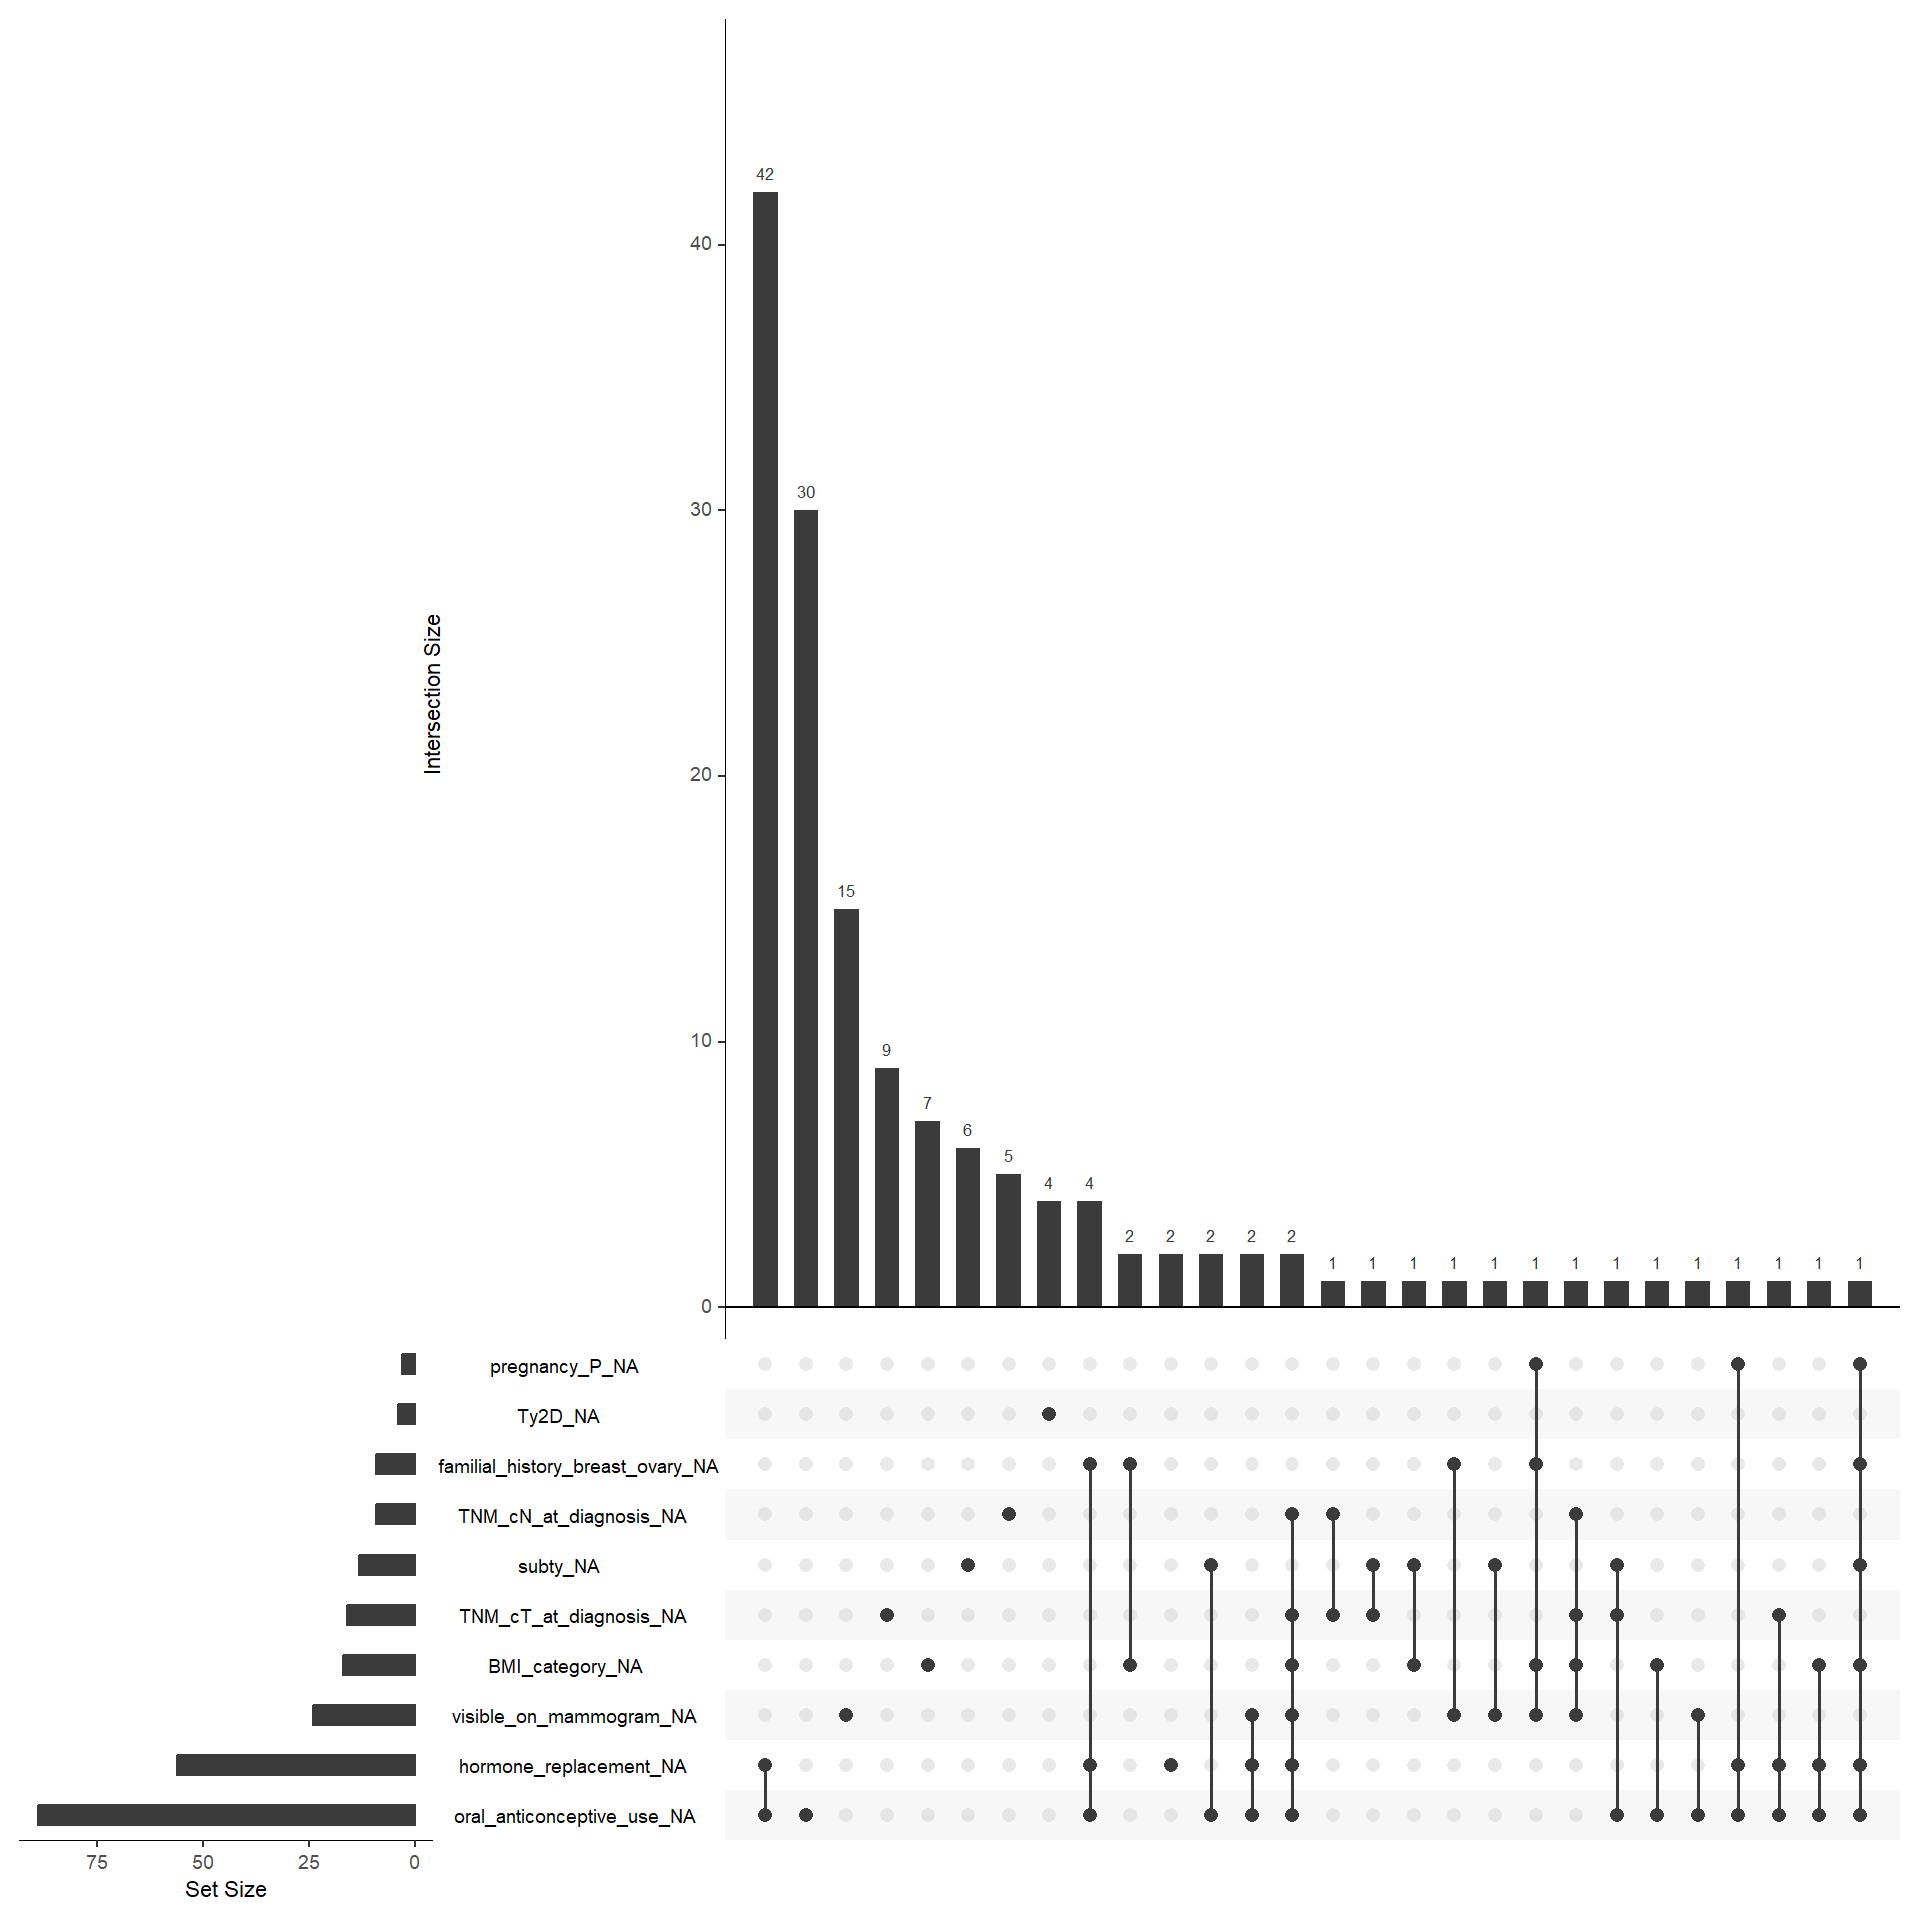
To perform the multivariate analysis we need complete information for every patient. This means that we have to analyse which variable is the most problematic in terms of missing values. In particular, we need to save as much as possible M1 patients since their limited number. The variables included in the matrix should be the following: age_category, BMI_category, smoking, alcohol_abuse, hypertension, hyperlipidemia, oral_anticonceptive_use, pregnancy_P, hormone_replacement, familial_history_breast_ovary, visible_on_mammogram, TNM_cT_at_diagnosis, TNM_cN_at_diagnosis, subty, M, Ty2D. I would exclude oral_anticonceptive_use and visible_on_mammogram. For M1 patients, alchohol_abuse is also frequently missing, but for the moment we leave it.
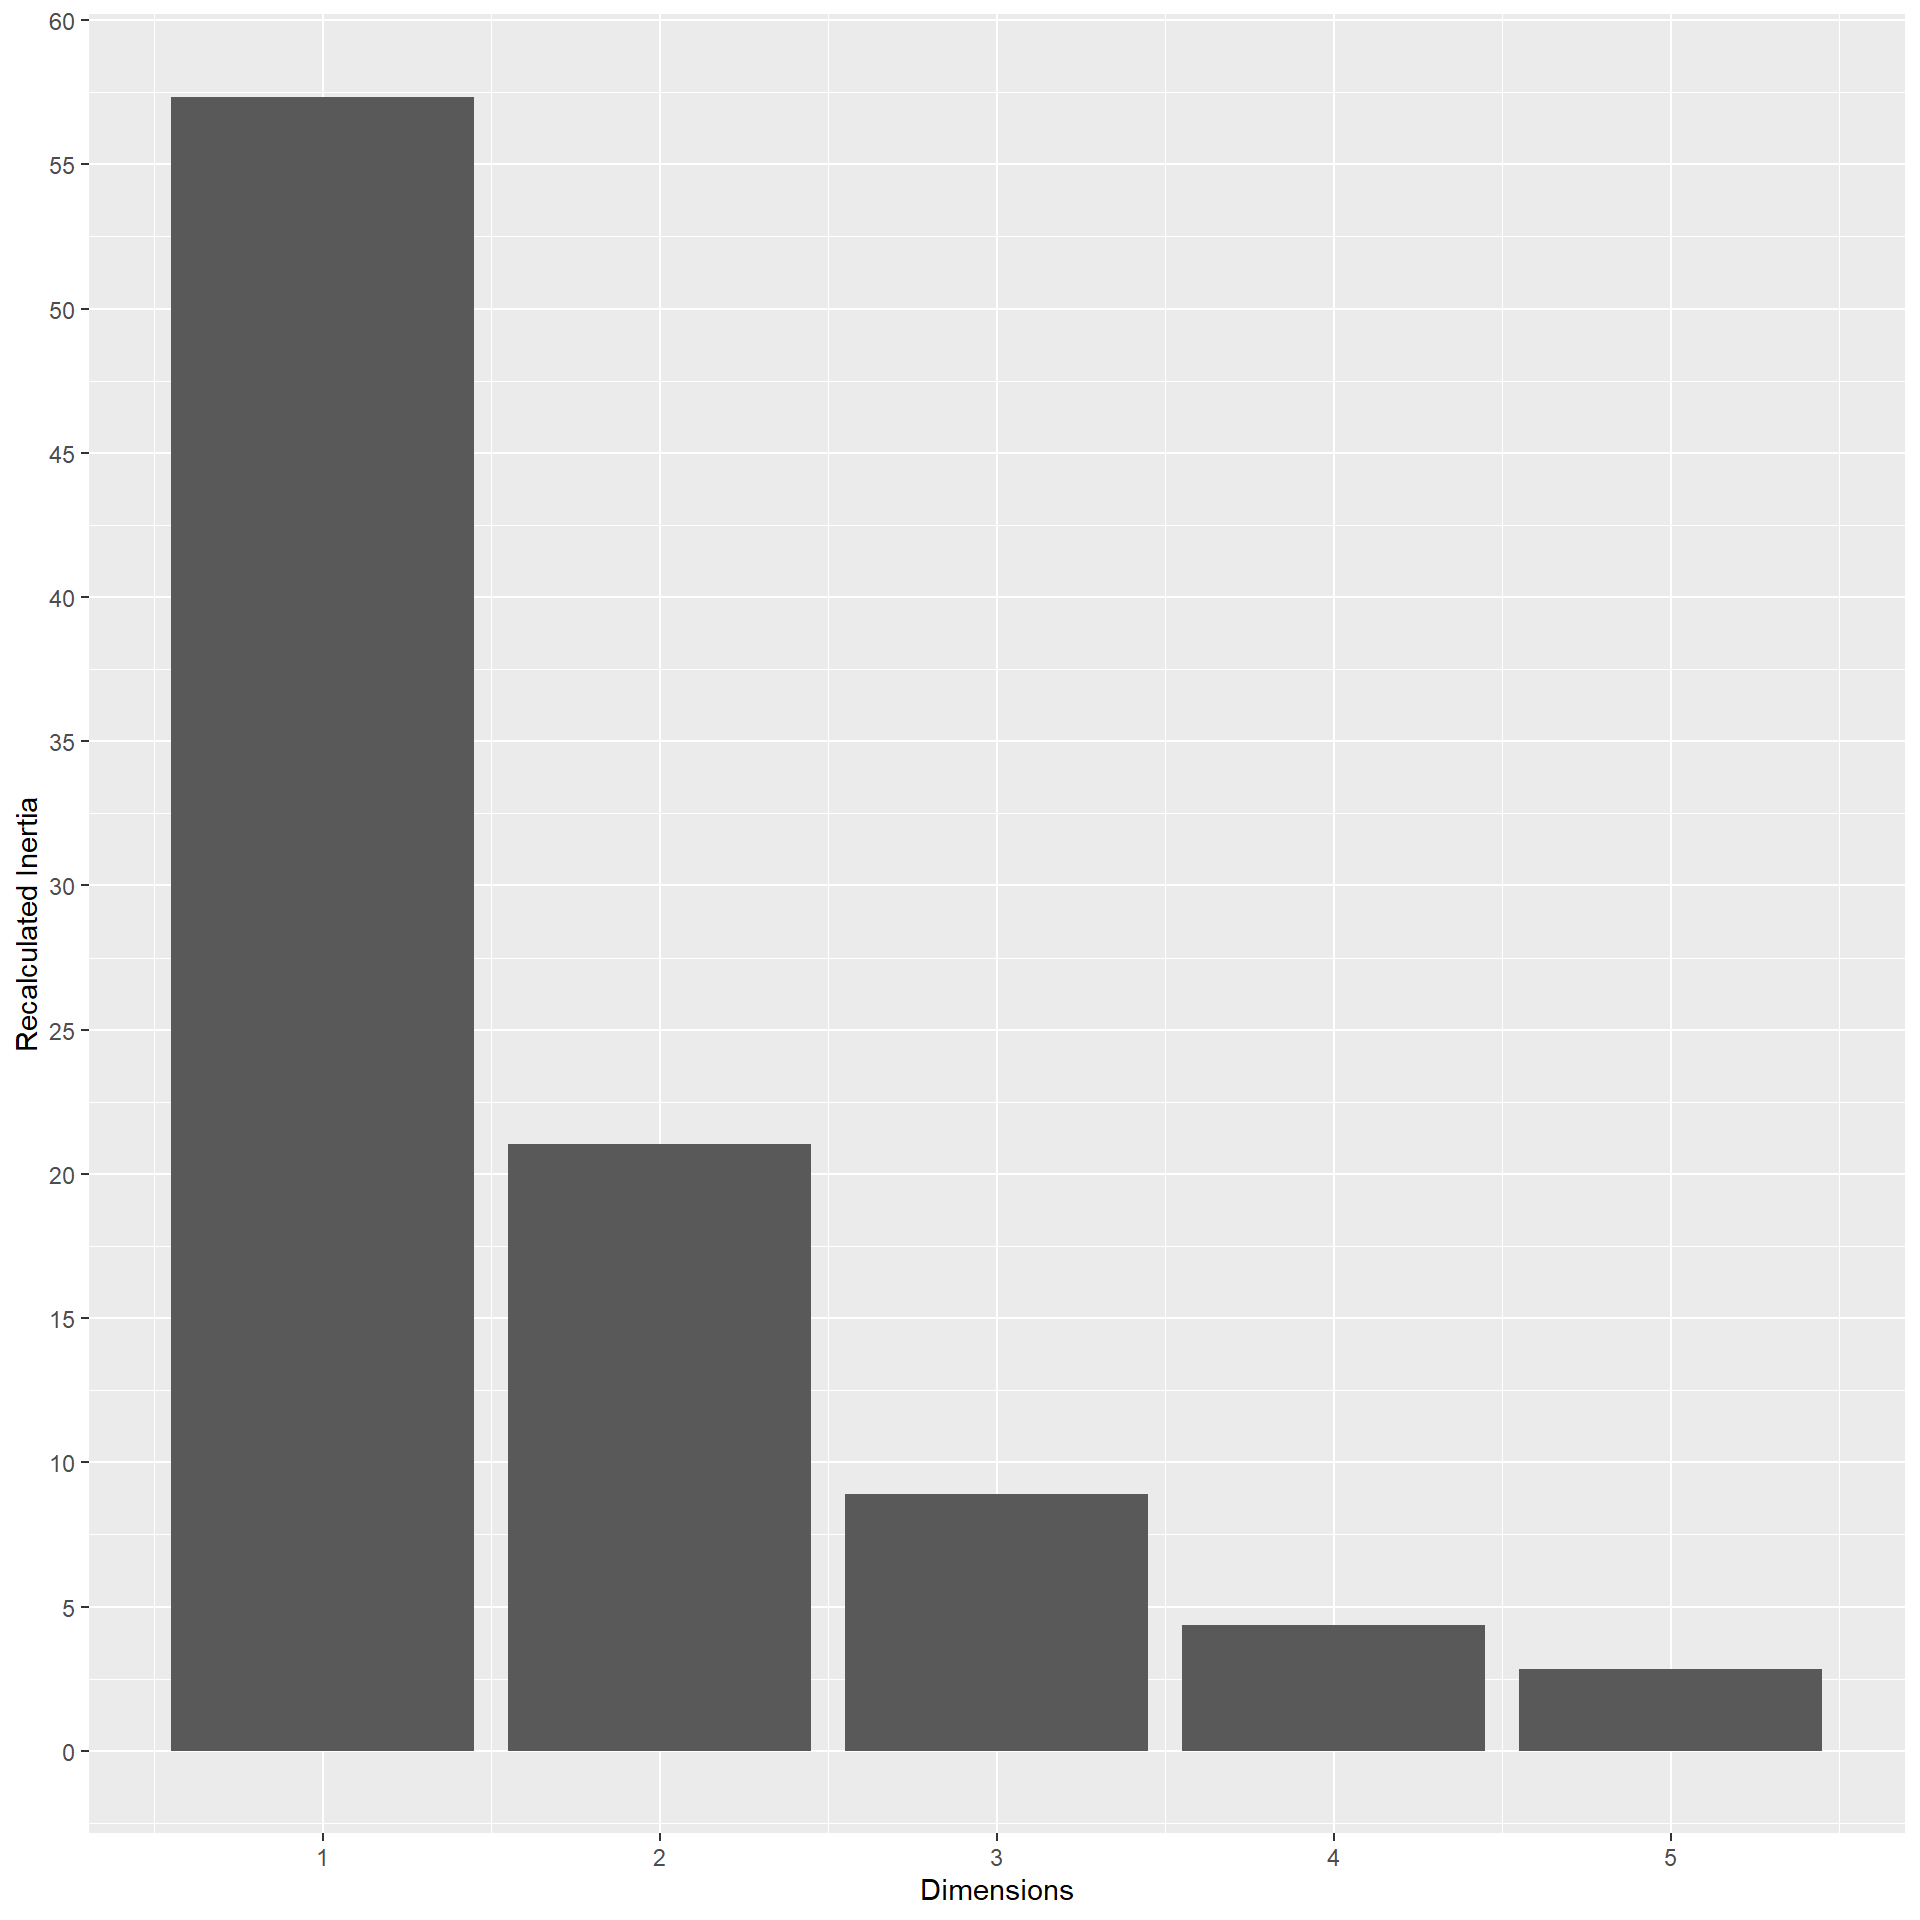
In the end we are left with 133 M1 patients. In the multiple correspondence analysis, actual inertia (variance explained) was recalculated considering the Benzecrie correction. The first five dimension explained 57.34, 21.03, 8.89, 4.35, 2.82, 1.58, 1.29, 0.84, 0.71, 0.54, 0.26, 0.23, 0.1, 0.03, 0.01, 0 of the variance respectively.
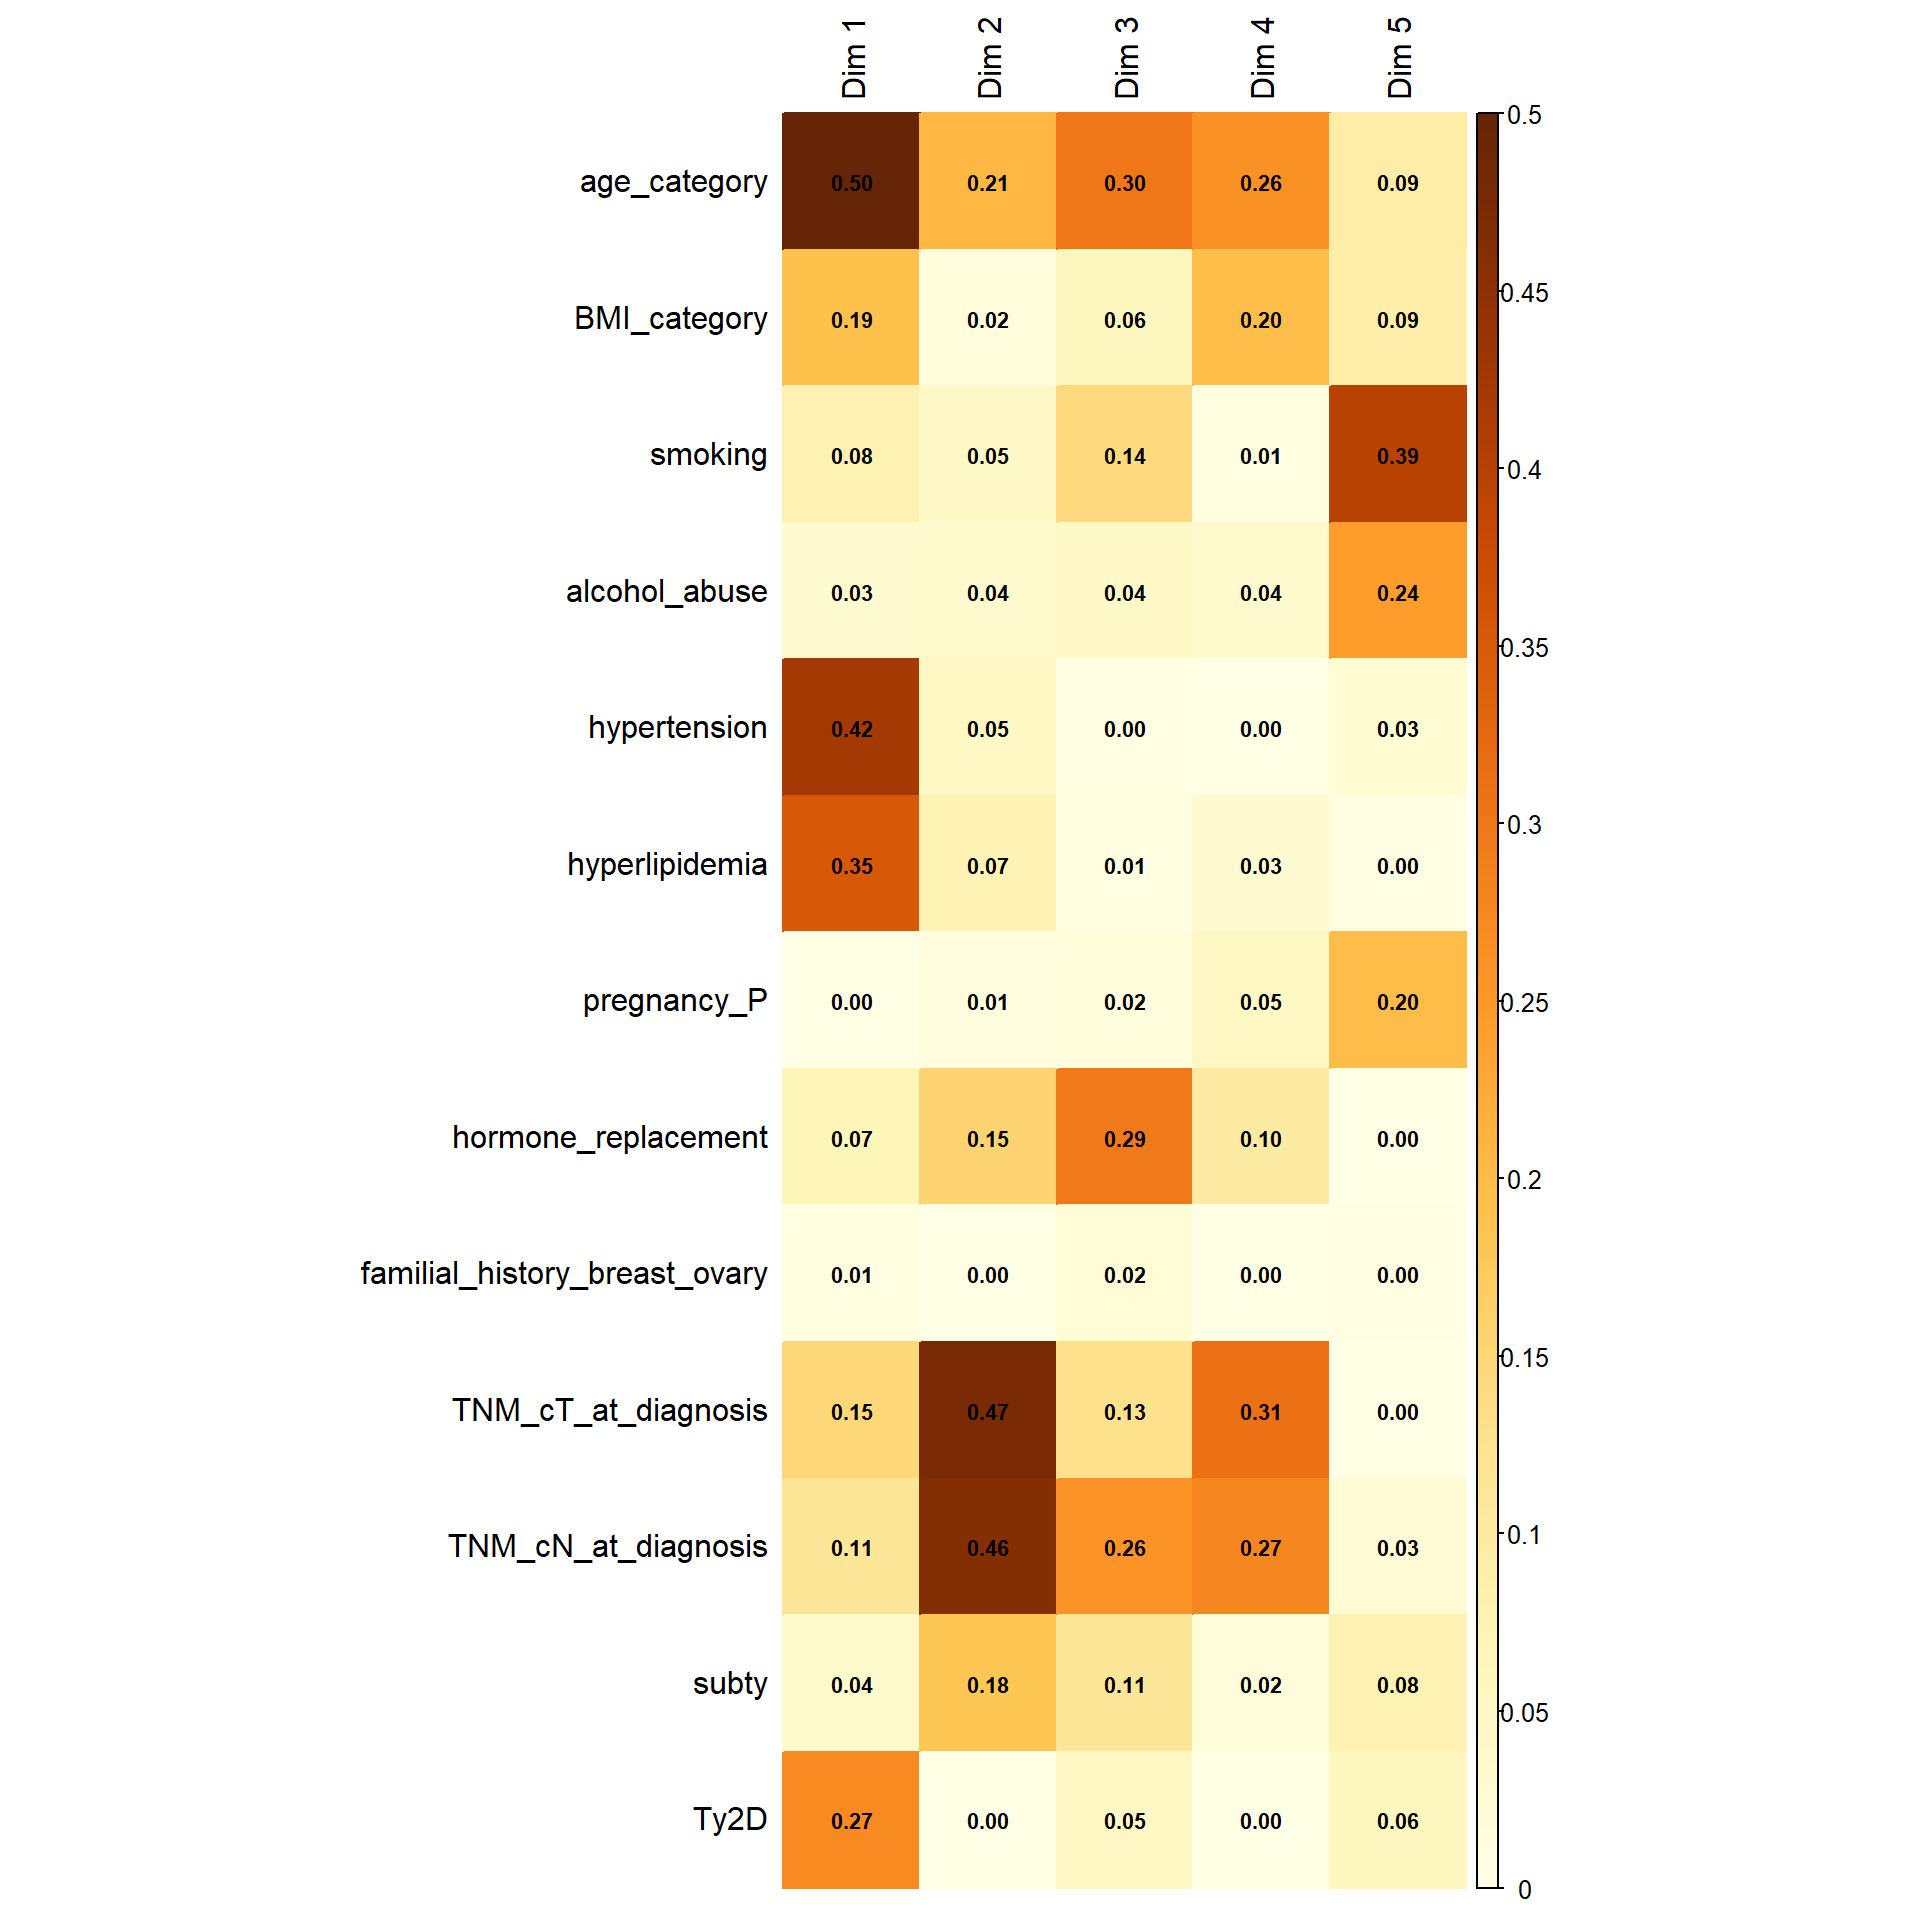
The following representation shows how the variables are correlated with the dimensions obtained. The first dimension is mainly represented by age, BMI, hypertension, hyperlipidemia, Ty2D, T and N. However, this latter are clearly separated in the second dimension, along with ER interpretation. Hormone replacement is clearly separated in the third dimension. However it is worth noting that the third dimension explains less than 10% of the variance.
This interactive plot represents the patients in the first three dimensions. The patients are colored depending on their M status. The cloud of M1 patients is well separated by the second and third dimension, less by the first.
In this table you can have a look of the characteristics of the patients:
Let’s have a look of patients 1389, 1267, 1280 and 1367
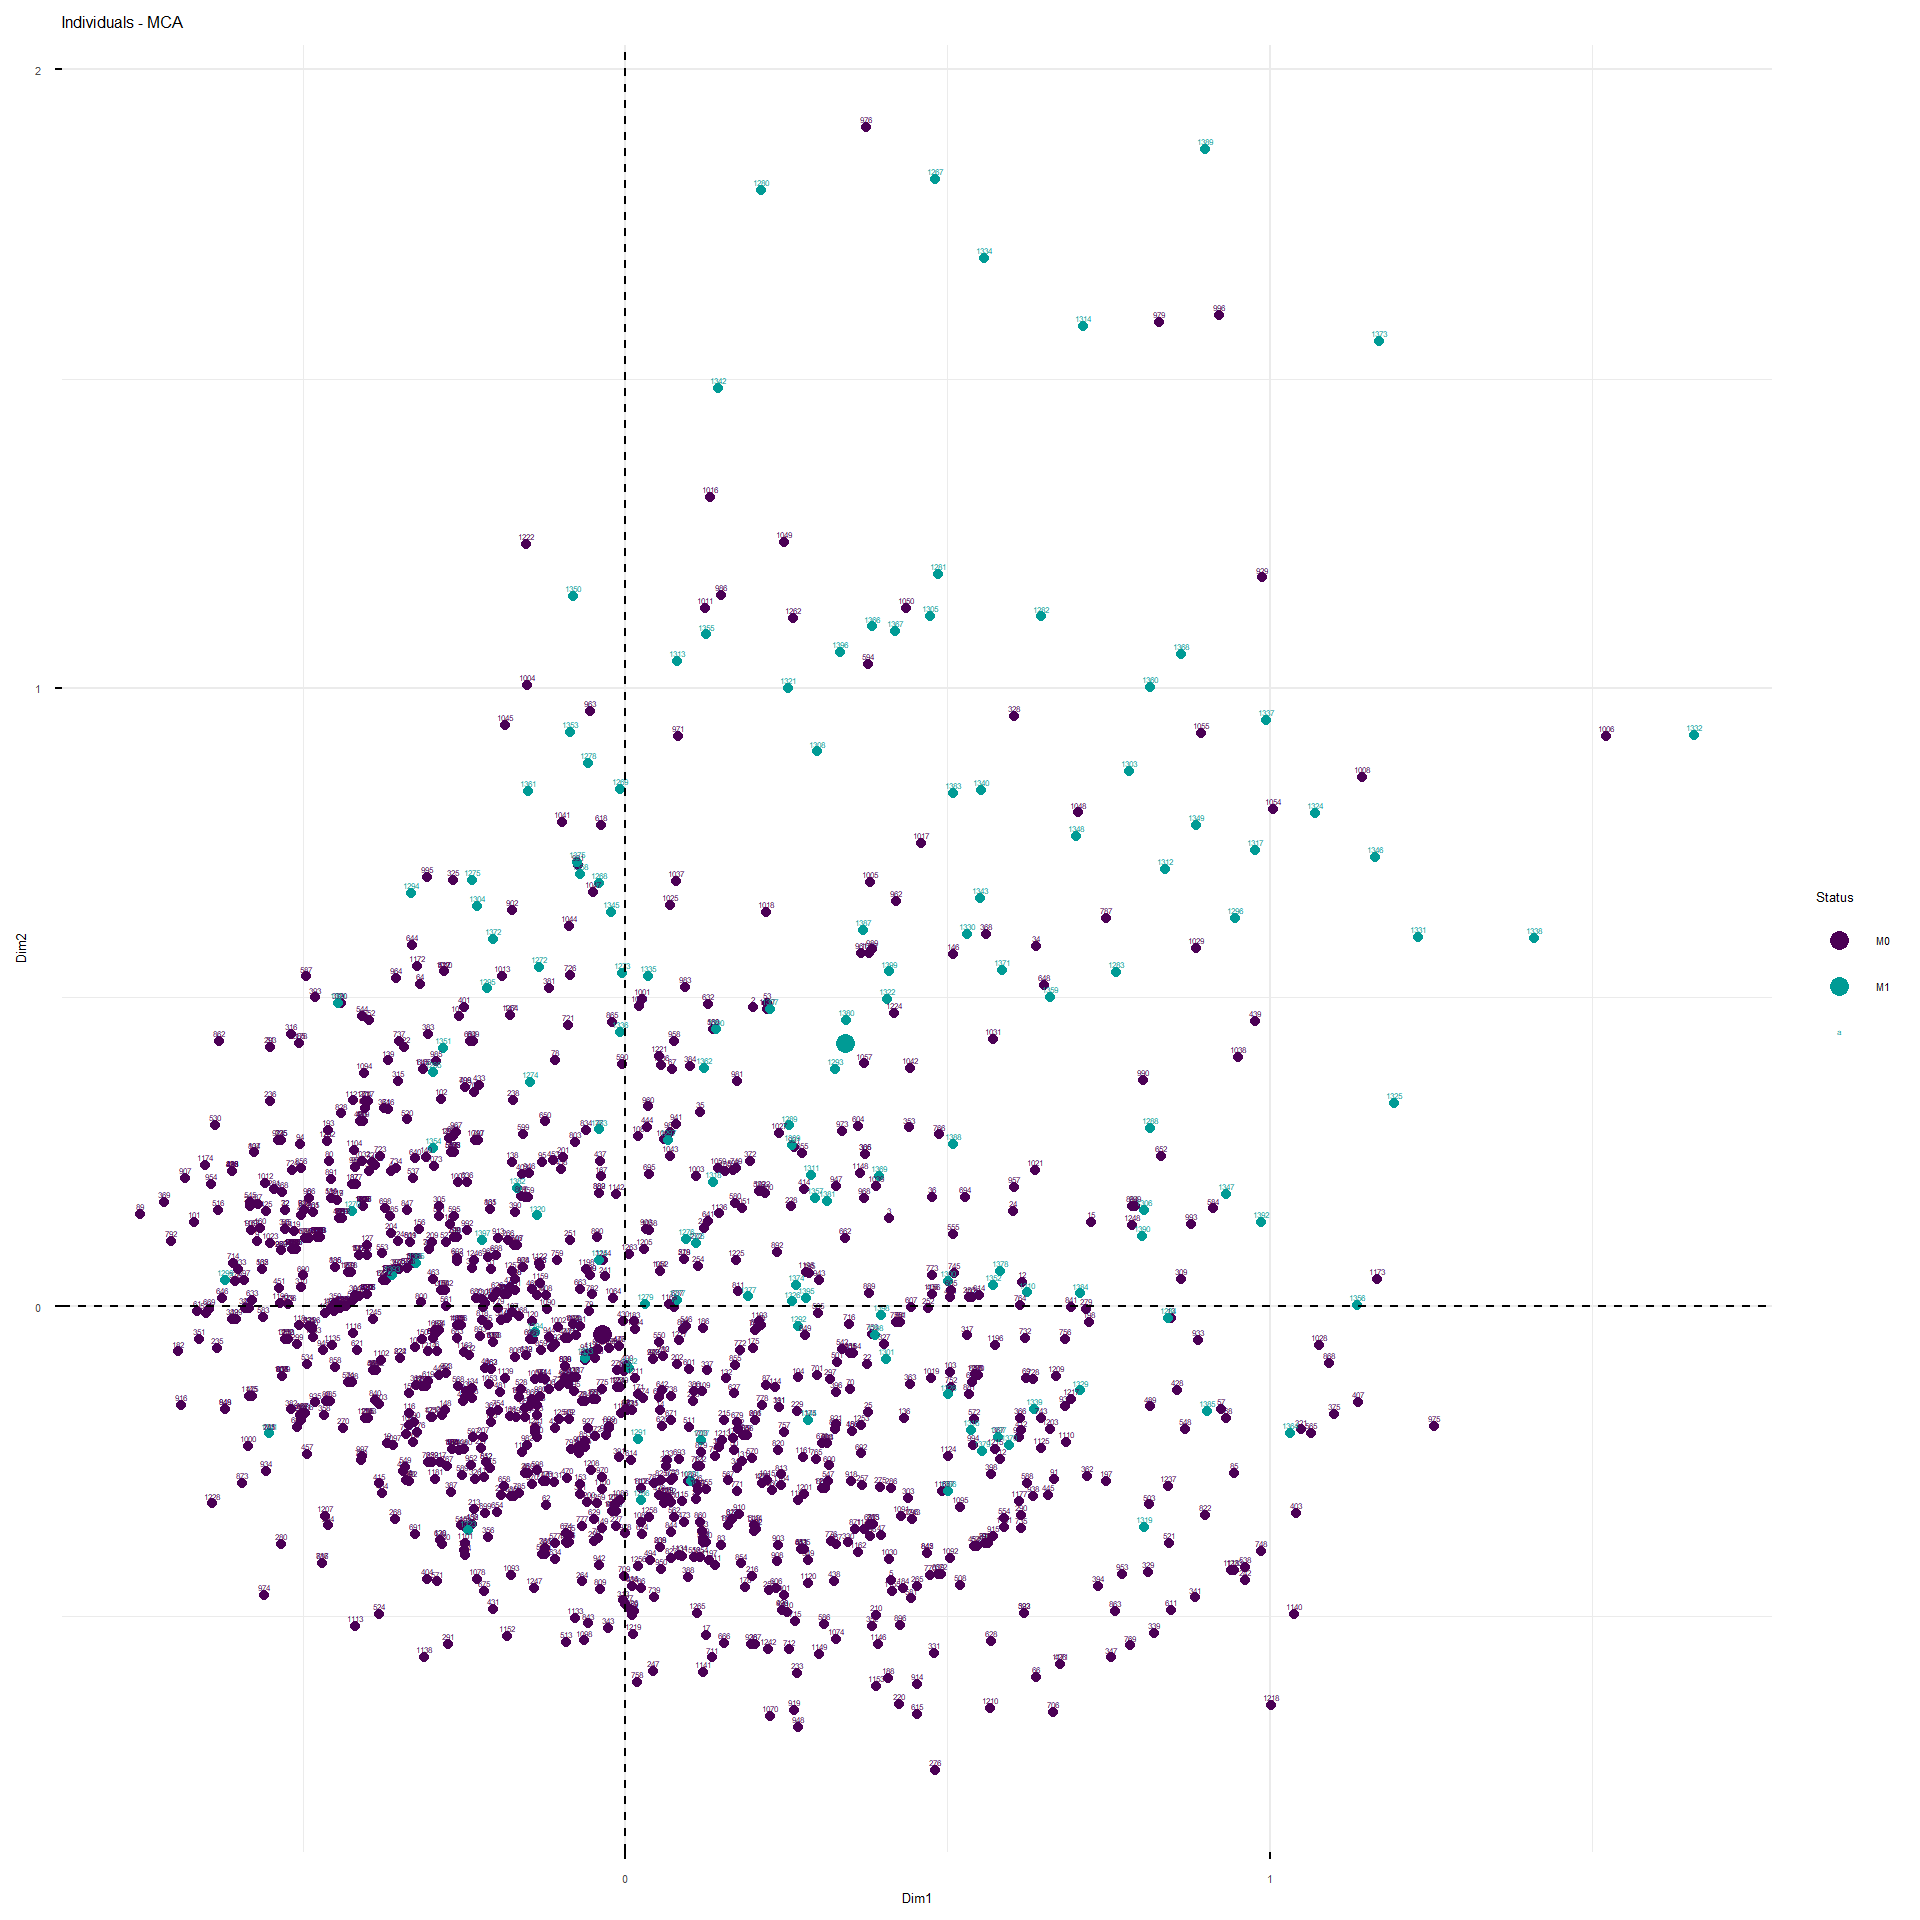
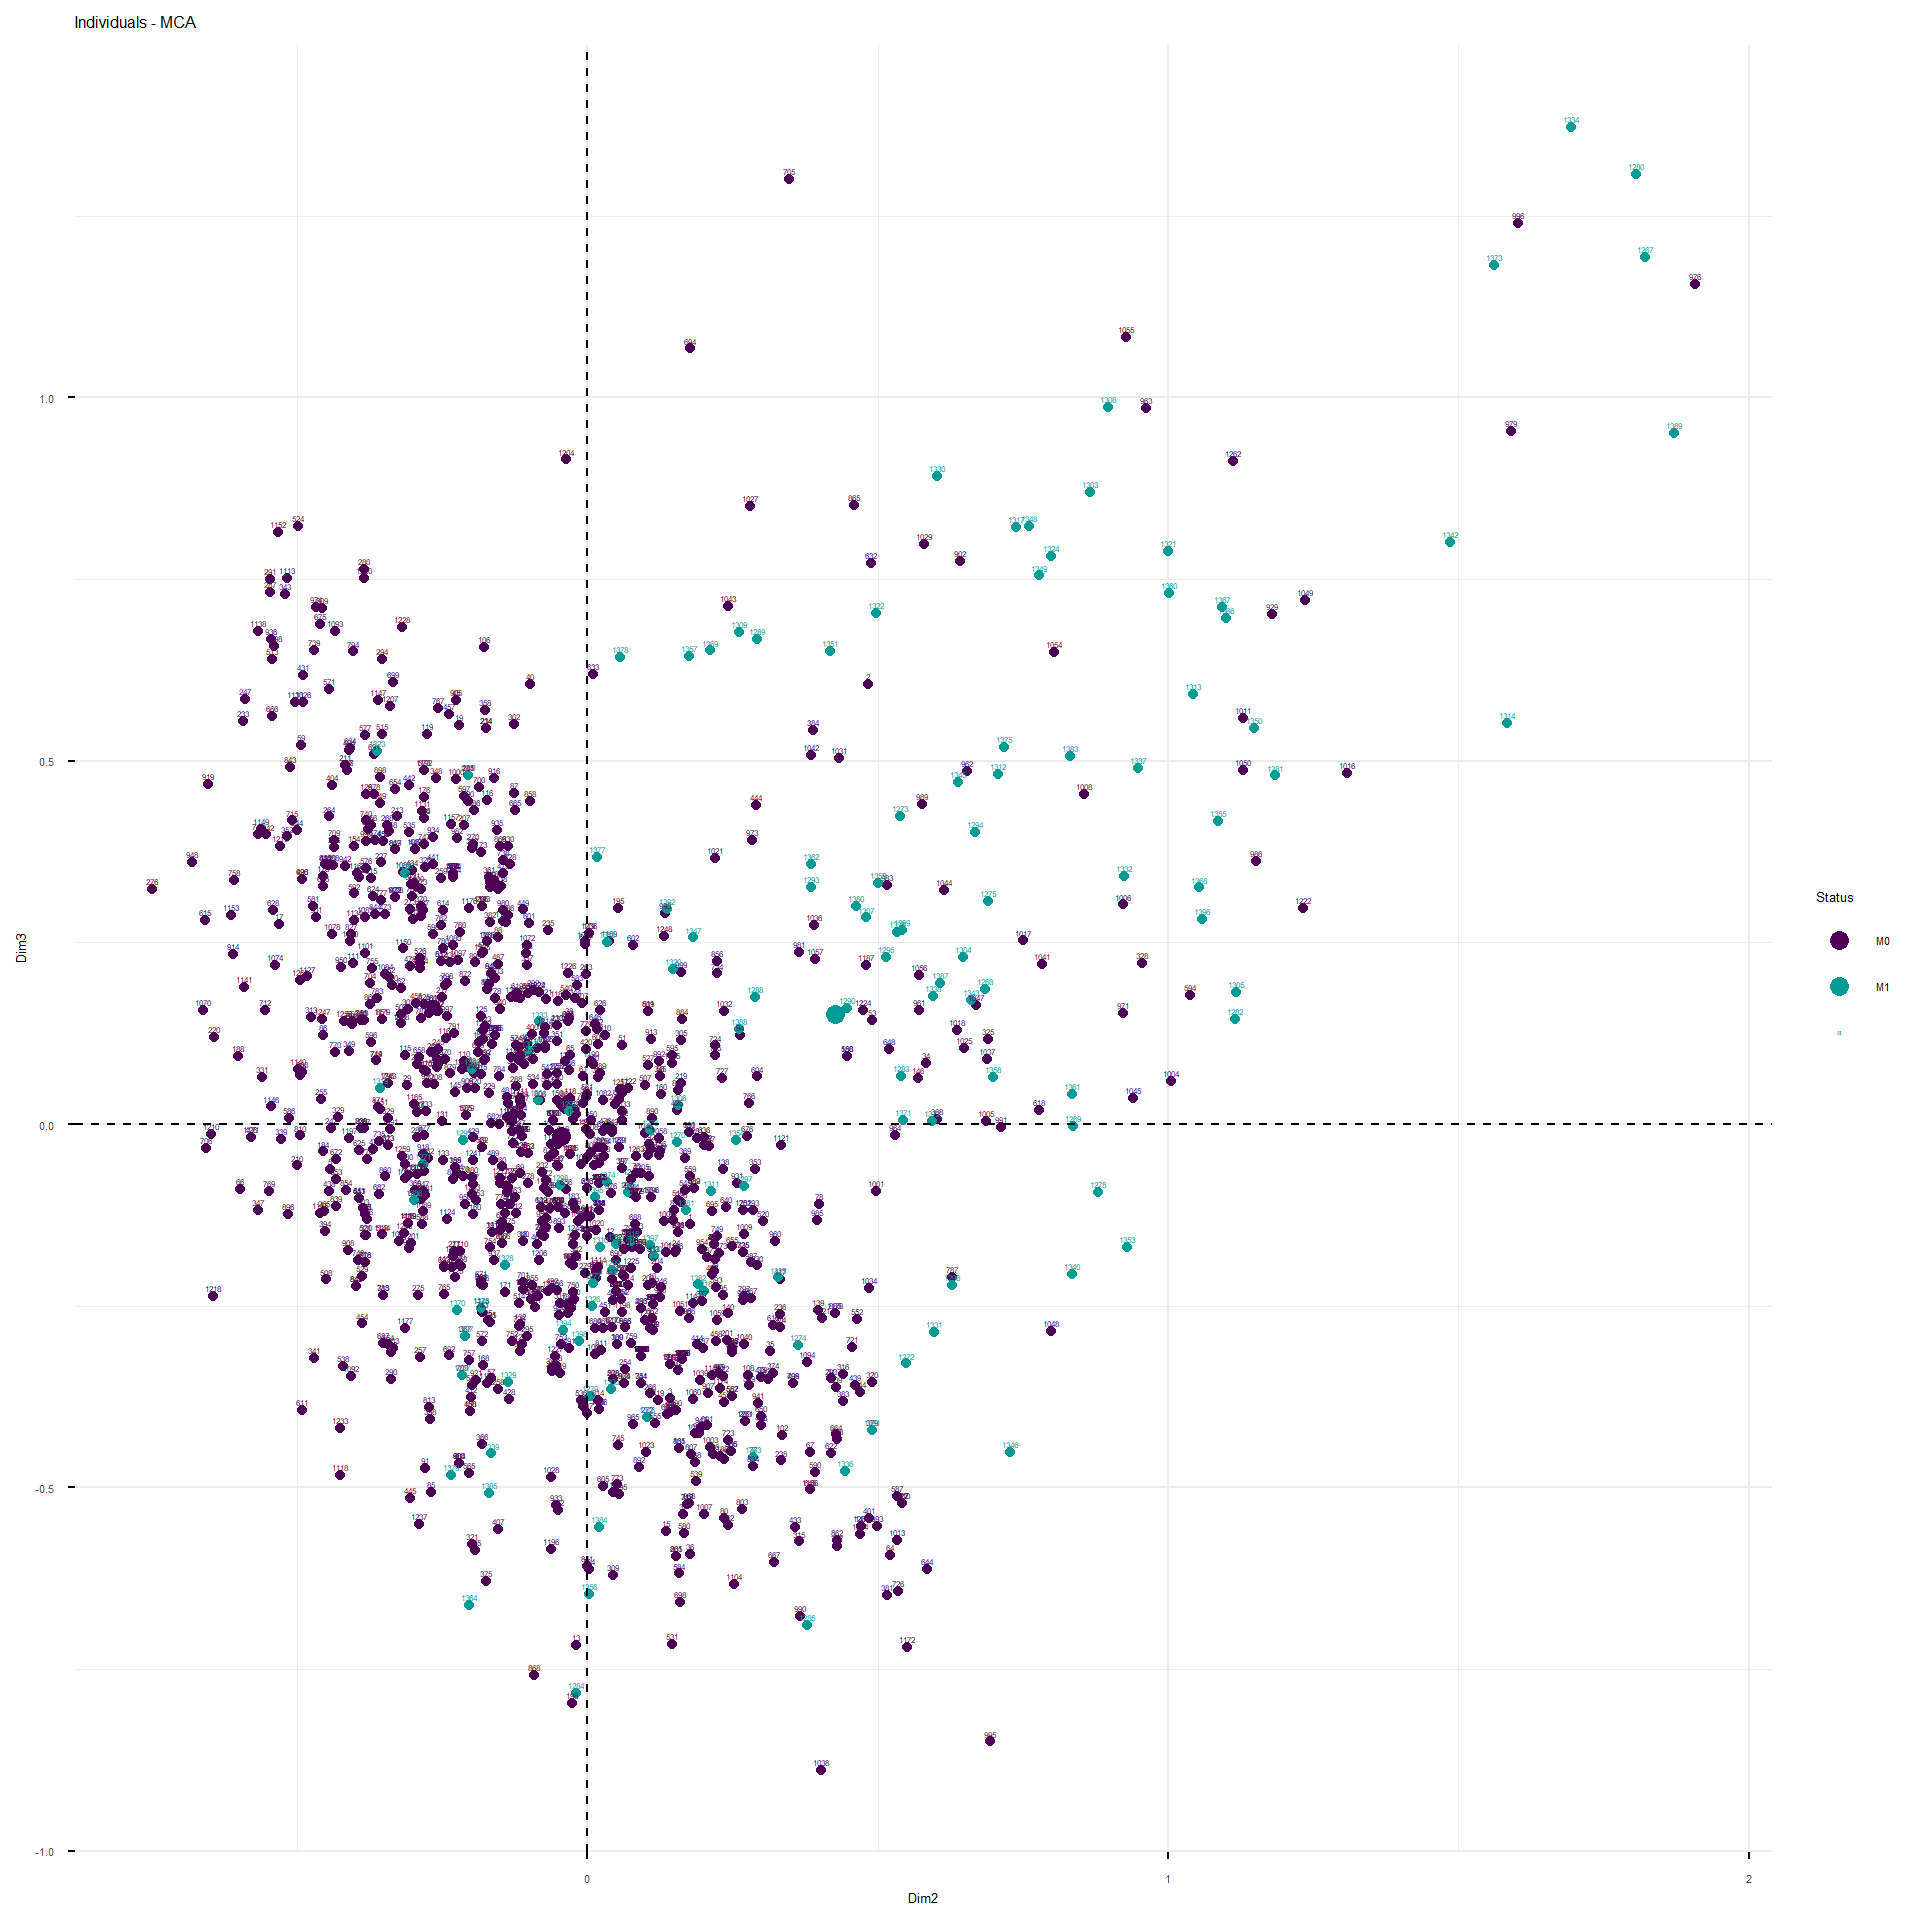
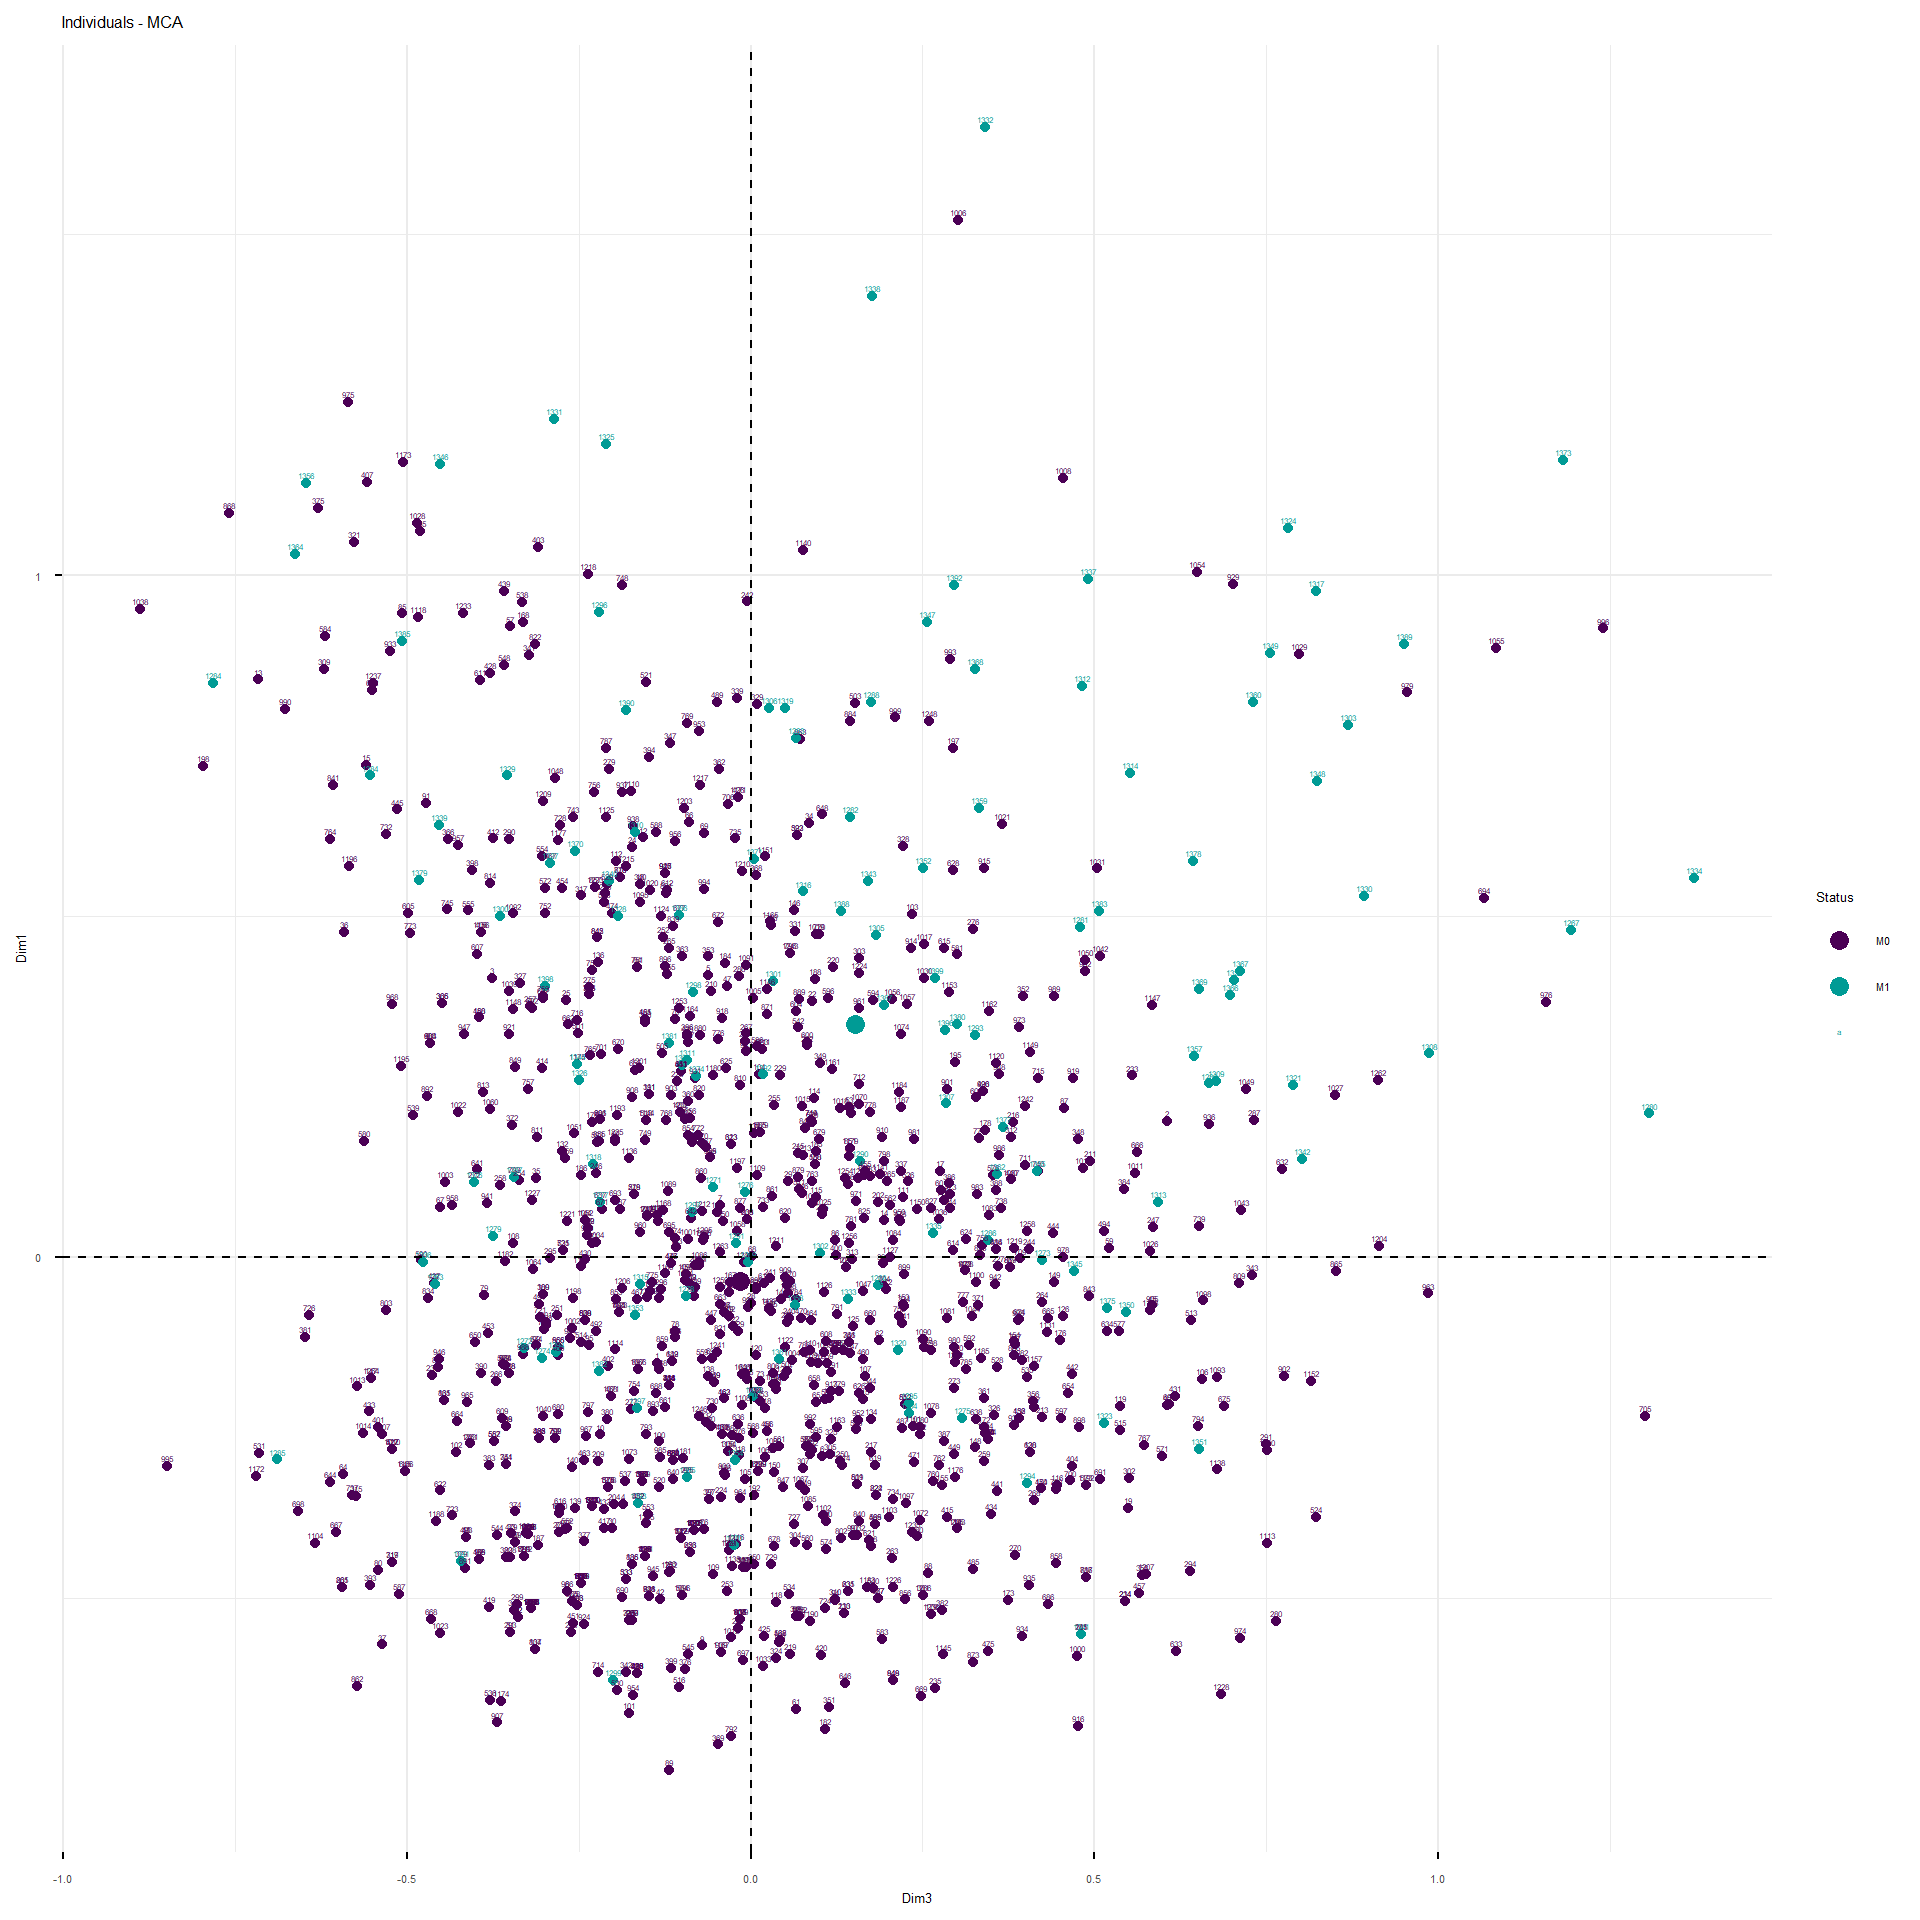
These are the representations of the planes identified by the MCA.
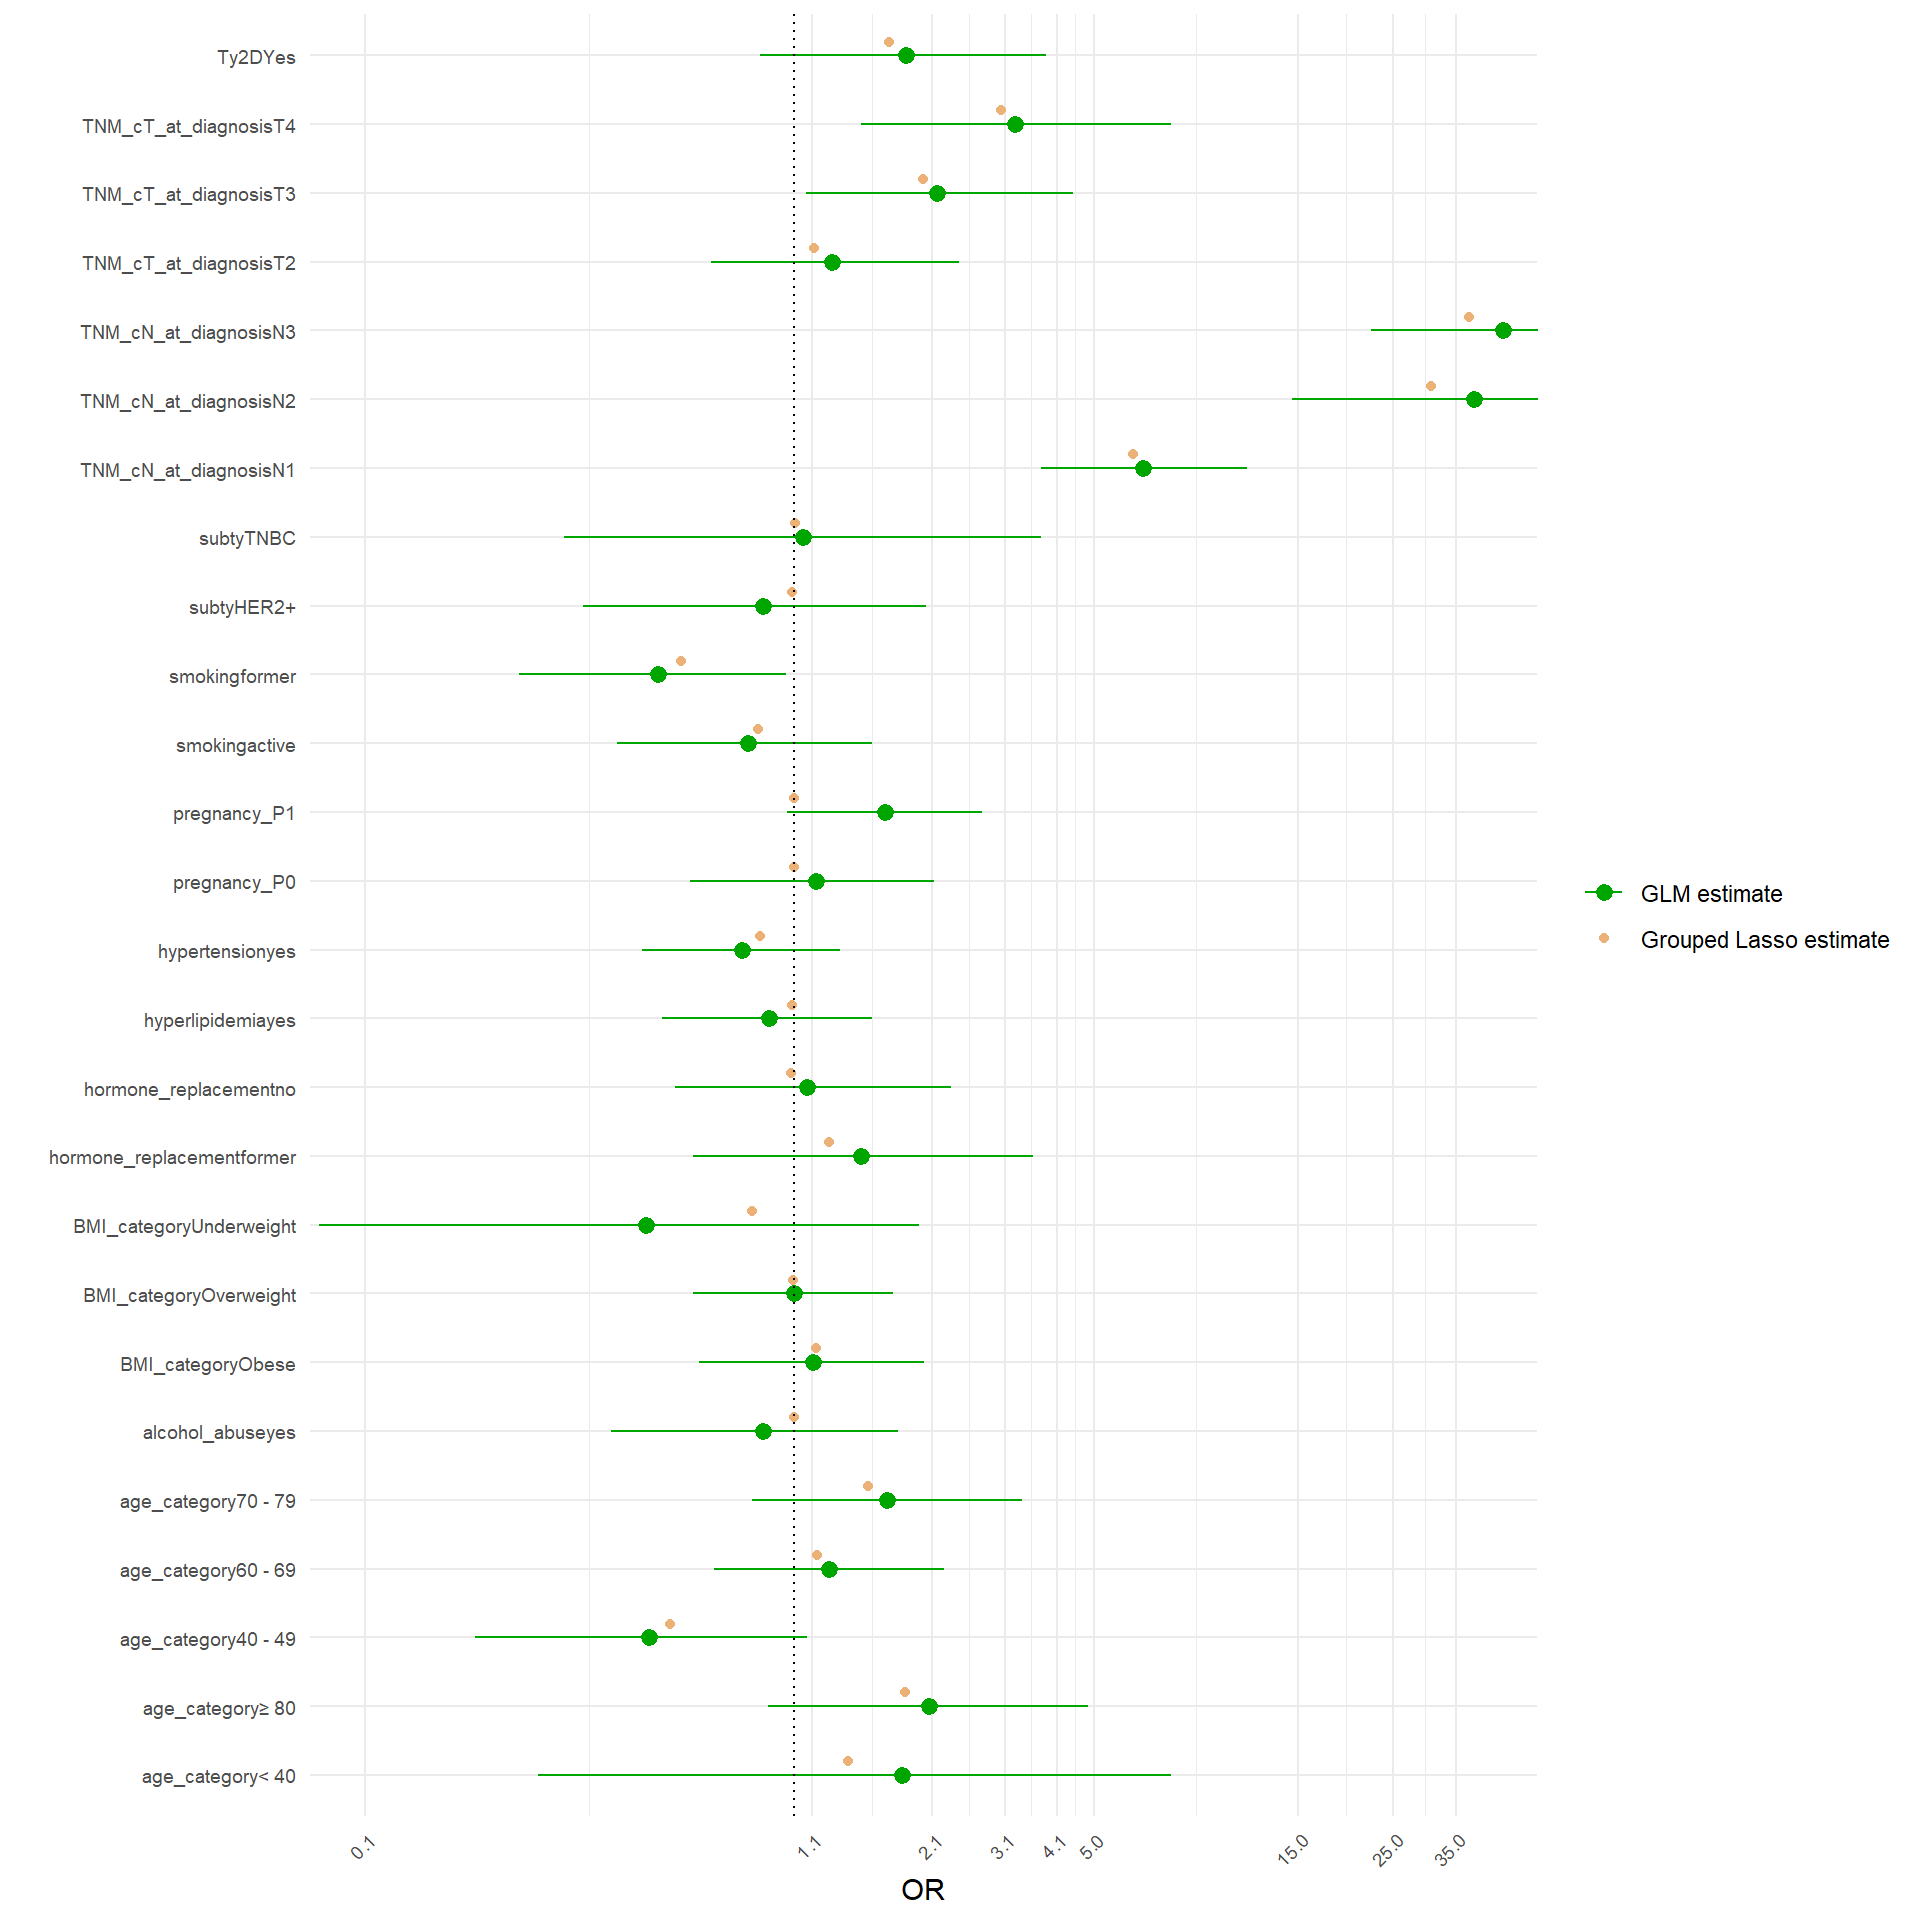
The analysis would proceed as follow. Since the structure of correlation identified by the MCA, I would fit a model with the following structure: M~ age_category + BMI_category + TNM_cN_at_diagnosis + alcohol_abuse+pregnancy_P+TNM_cT_at_diagnosis + hypertension + hyperlipidemia + ER_Interpretation + HER2_Interpretation + smoking +Ty2D + hormone_replacement . For the moment I would leave familial_history_breast_ovary apart, since it was not separated on any of the first five dimensions. I will use grouped Lasso to see whether some coefficients of the model considered are shrunk to zero. Groupd lasso is slightly different to classical lasso because it applies a mixed form of penalization: L2 within the variable coefficients and L1 between the variable coefficients, so that if a variable, as a whole, does not contribute to classification, it is shrunk as a whole. I applied 10-fold cross validation, stratified so maintain the same ratio of cases vs non-cases in each fold, to obtain the classification error as a function of the L1 and L2 penalty to apply.
[1] "Running Stratified Cross-Validation..."[1] "Optimal Lambda (min error): 0.000410618867831329"[1] "Optimal Lambda (1-SE rule): 0.00472111915731369"