7 Factors associated to early and late distant recurrences and mortality in ILC patients
7.1 Event history
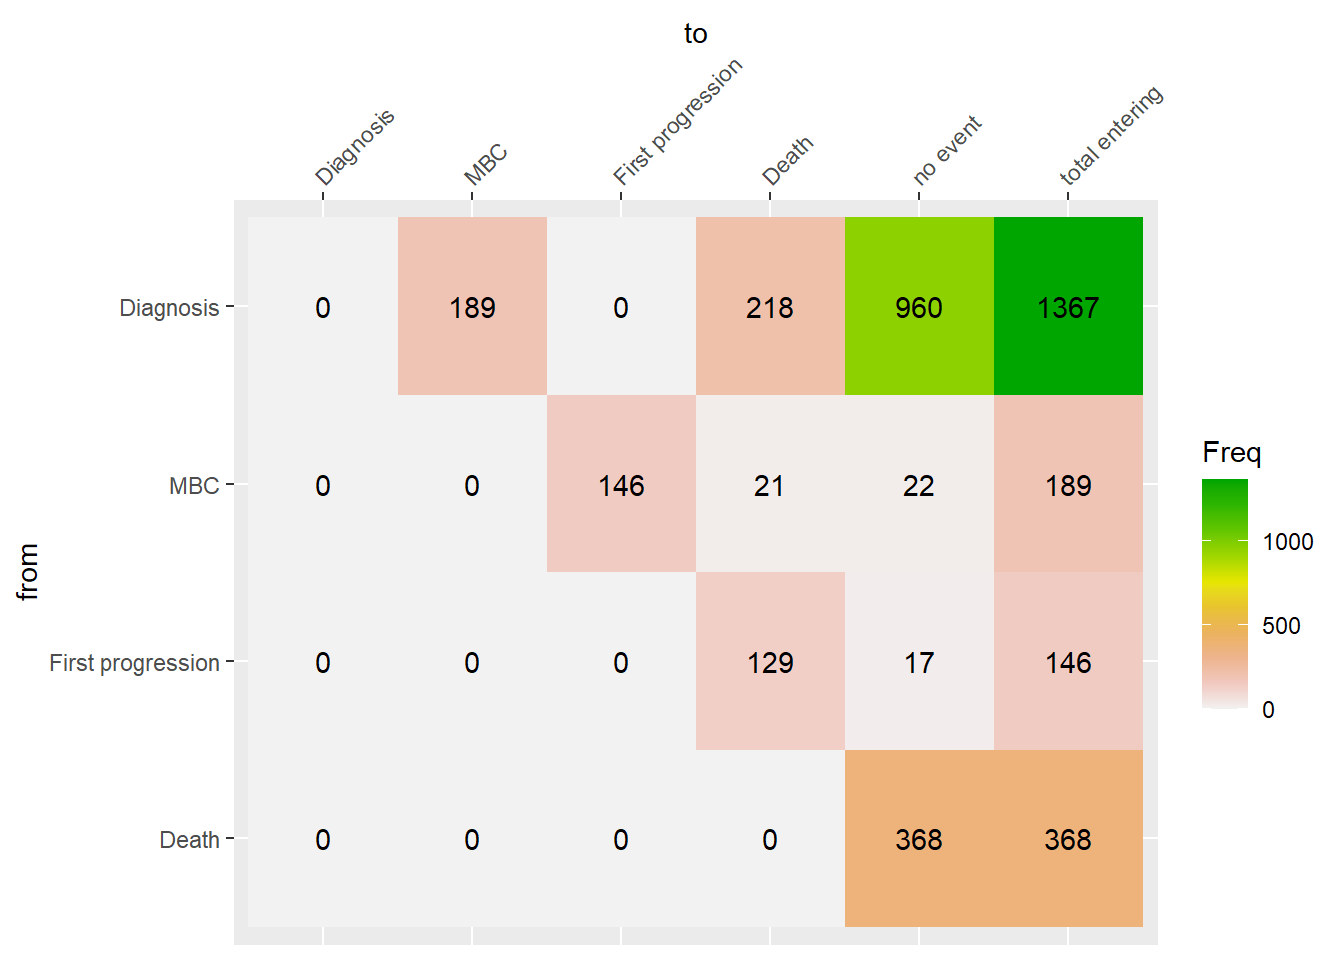
For the moment I evaluated the endpoints overall survival (OS) and distant metastasis free survival only in ILC M0 patients. We could perform the same but separate analysis for dnILC patients for the mortality end-point to see whether results are concordant. In the following figure I reported the event history of the patients: from diagnosis, 189 develop distant metastases while 218 die without evidence of distant metastases. For those who become metastastic, 146 have a first progression, while 21 die without a first progression. Among those had a first progression 129 (out of 146) eventually died.
To evaluate factors associated to early and late distant recurrences and mortality we can proceed as follows. Instead of using a landmark approach (filter patients survived at 5 years and run an additional model for a follow-up of 5 to 10 years), we can adopt a joint model called piece-wise cox model. Briefly, the follow-up time is divided into two intervals (0-5 years: > 5 years). Inside the interval no parametric distribution are assumed, only proportional hazard (PH). Each covariate included in the model will have two effects: one for the early period (0-5 years), one for the late period (>5 years). This is more parsimonious than considering a piecewise exponential model with splines and modeling a time-varying hazard ratio for each factor. Also we avoid filtering out patients and building two separate models.
In the following models, only time period x factors interactions are considered. However, if of interest, we could also test whether the effect of a factor differs significantly between early and late period.
Variables (factors) considered for the moment are: BMI, TNM_cN_at_diagnosis , TNM_cT_at_diagnosis , age,hypertension,hyperlipidemia,subty,smoking,hormone_replacement,Ty2D. For age and BMI I am considering only linear terms, to maintain the number of model parameter as low as possible.
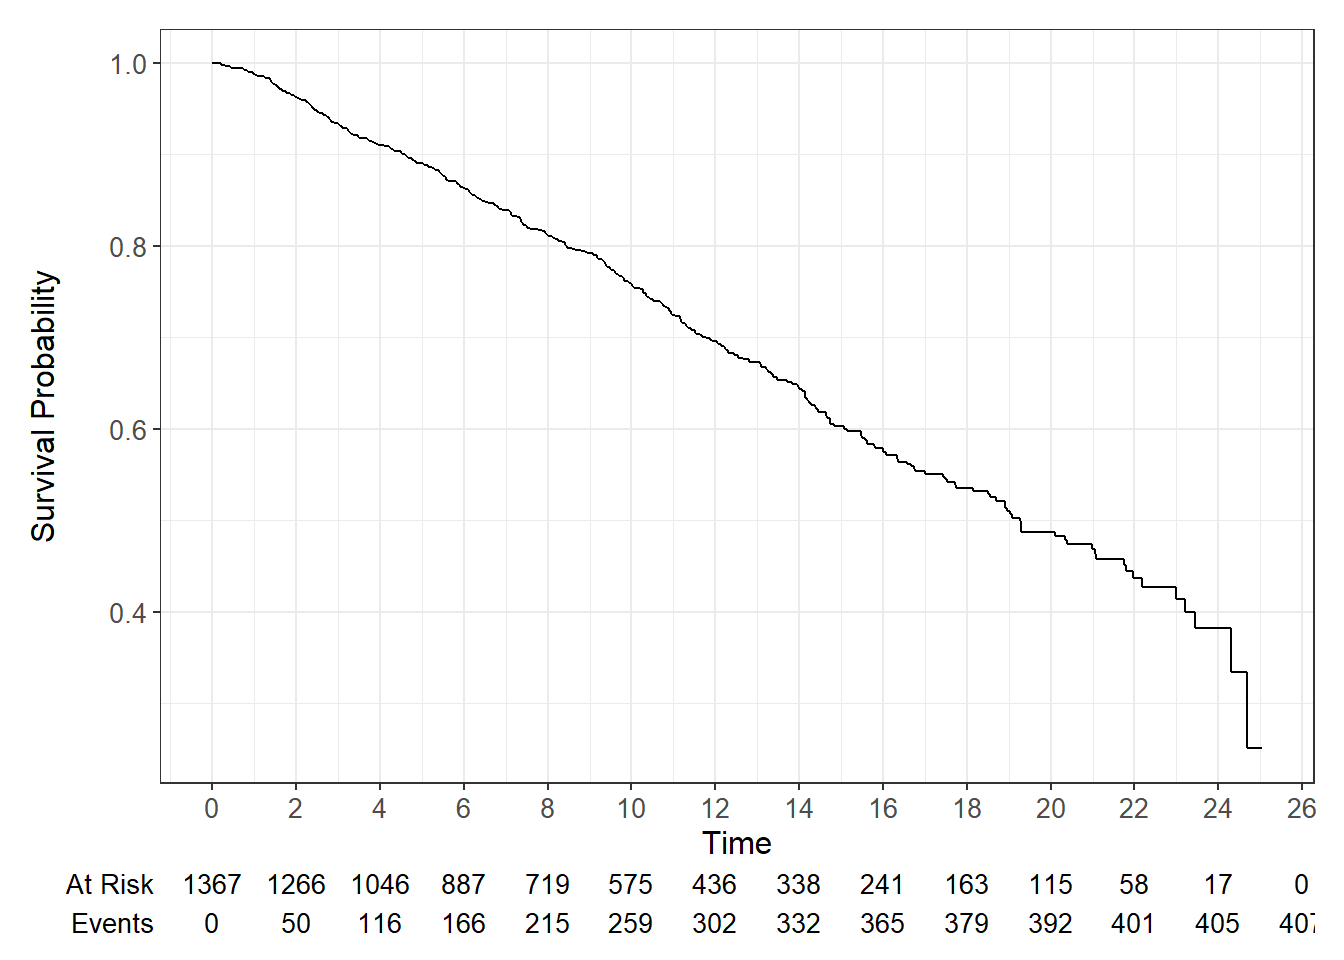
7.2 Overall survival endpoint
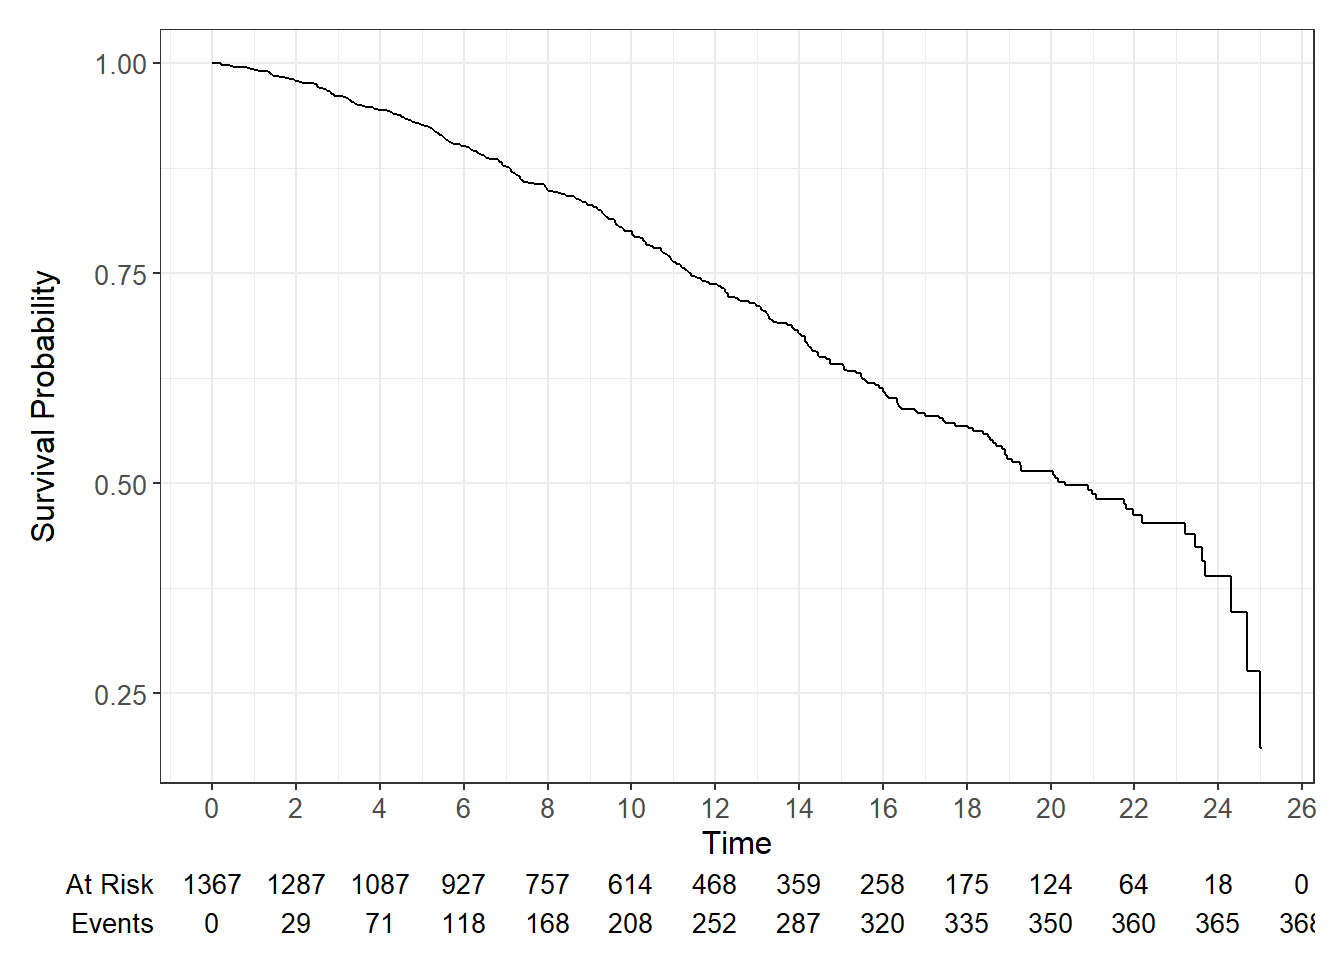
This figure represents the overall survival curve for the 1367 patients considered in the analysis.
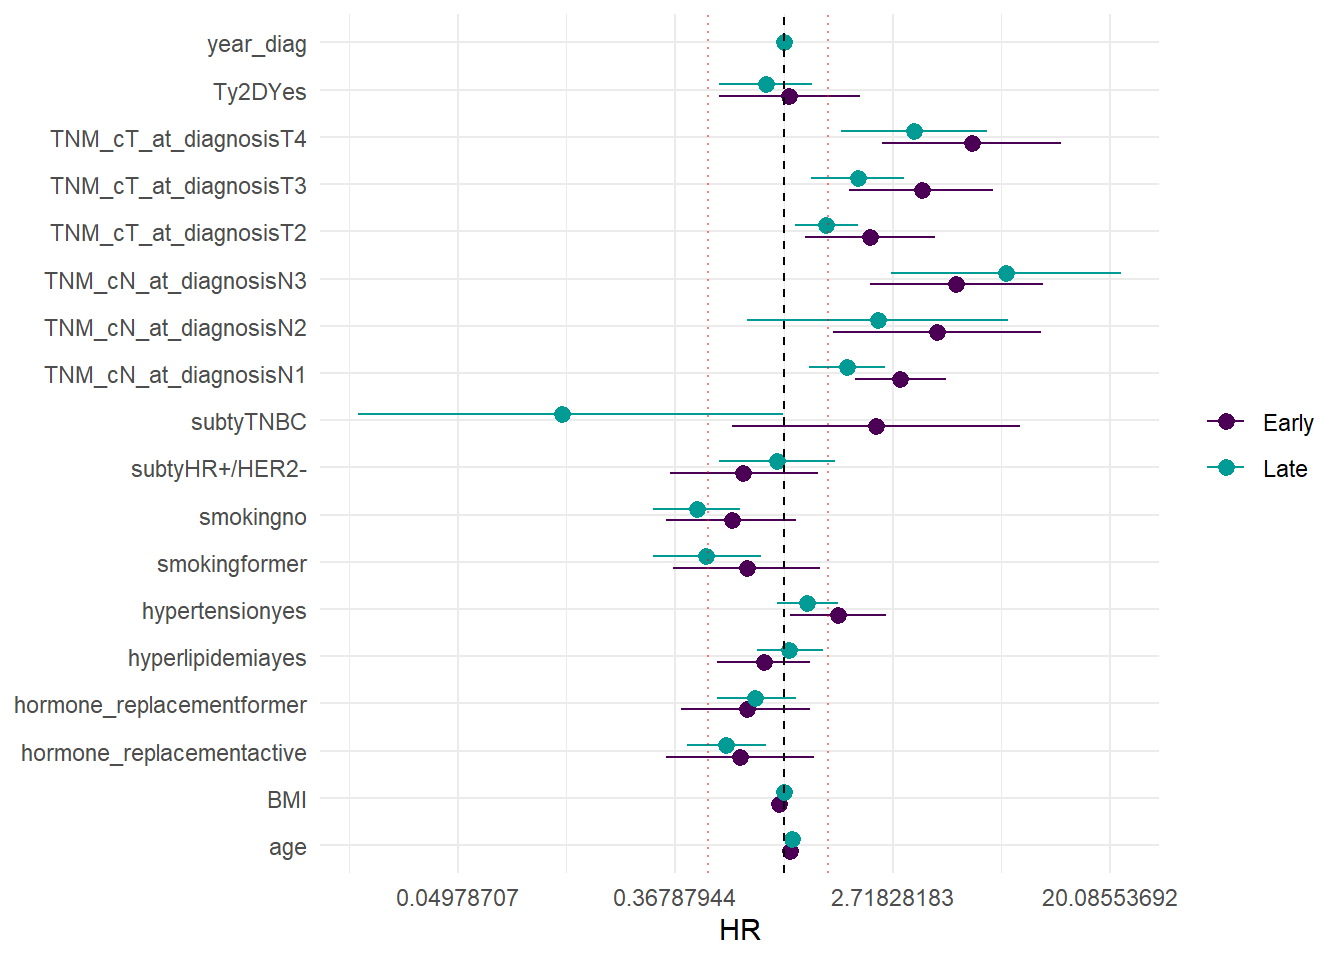
The following forest plot indicates the association of the factors considered in the analysis with early (purple) and late (green) mortality. Year of diagnosis (year_diag) was considered in the model to see whether a calendar effect could be present.
7.3 Distant metastasis free survival
The following figure represents the distant metastasis free survival curves for the 1367 patients considered in the analysis.
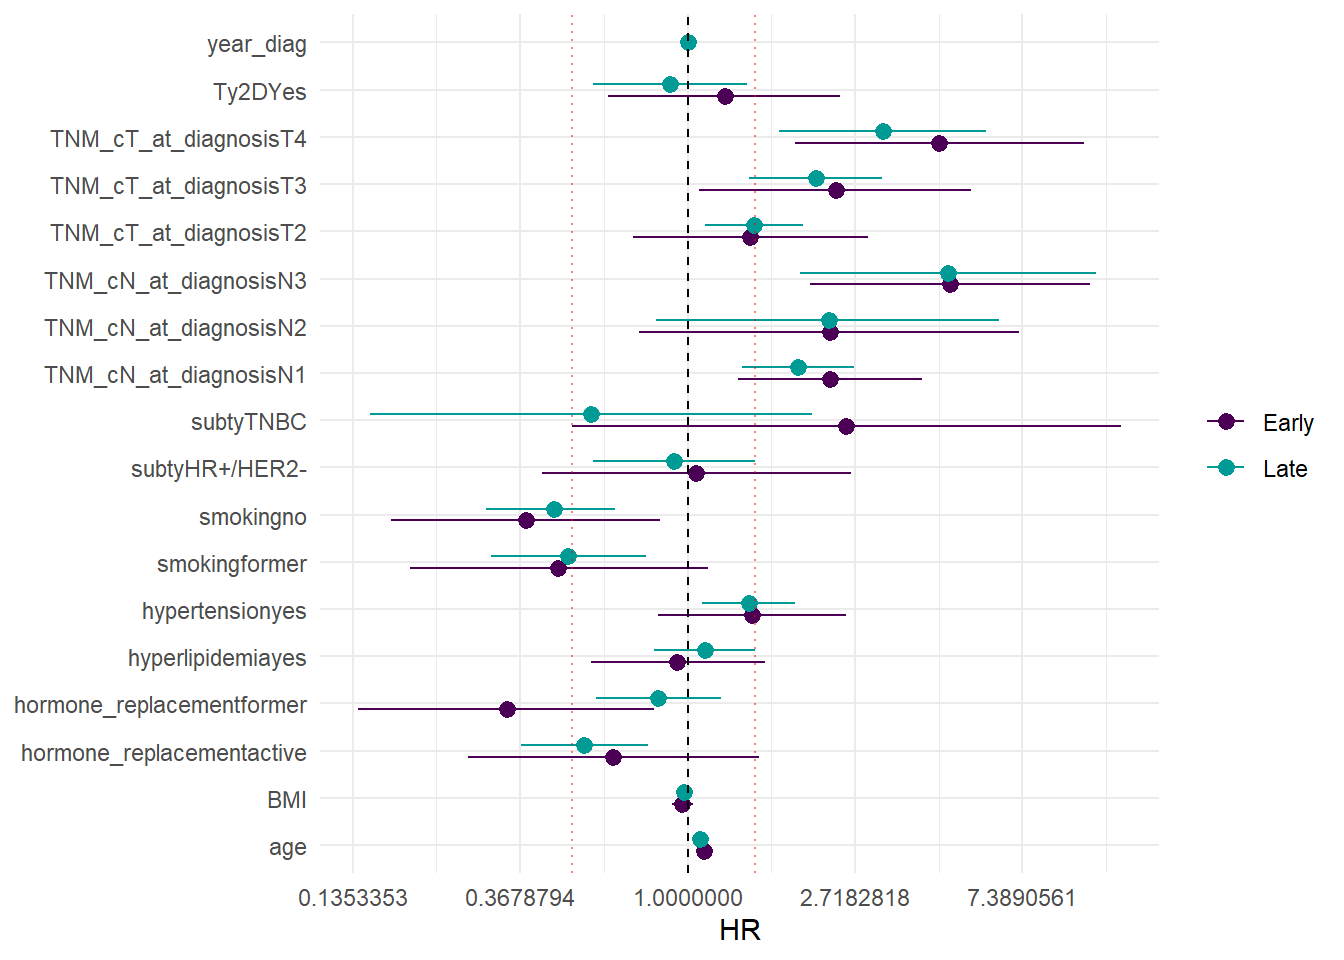
The following forest plot indicates the association of the factors considered in the analysis with early (purple) and late (green) distant metastasis free survival. Year of diagnosis (year_diag) was considered in the model to see whether a calendar effect could be present.