The analysis is structured as follows. We first shows the absolute frequencies of ILC and other BCs or De Novo M1 ILC and Total ILC to see individually the components of the ratios we will compute (i.e., ILCs / other BCs and De Novo M1 ILC / Total ILC). This is critical to assess that the potential increase in the proportion is mainly related to an increase in the number of ILC or De Novo M1 diagnosis. A simple smoother is applied to see what is the general trend of the number of diagnosis among the years.
The we focus on modeling the relative proportion of cases (De Novo M1 ILC diagnoses over ILC diagnoses; ILC diagnoses over Total BC diagnoses) considering a poisson model with an offset which is the log of the denominator of the ratio. In the analysis, year is included first as categorical variable and then as a numerical variable.
For the categories of year we report the relative increase in the proportion considering as a reference value a specific year. We also report the predicted values of the proportion of cases as as function of the specific years. In the analysis of year of diagnosis as numerical, we simply report smoothed estimates of the proportion of cases as a function of years of diagnosis.
We first analyse the proportion of De Novo M1 ILC over the total ILC in UZ Leuven. Figure 4.1 shows the raw number of M0 and De Novo M1 and total diagnoses for each year between 2000 and 2023. Figure 4.2 shows the raw proportions of cases for each years. For both the representation, a LOESS smoother is applied to identify a general trend. Overall, both the absolute number of M0 and M1 diagnoses seems to increase over the years. However, the proportion of De Novo M1 seems to increase why the proportion of M0 decreases over time.
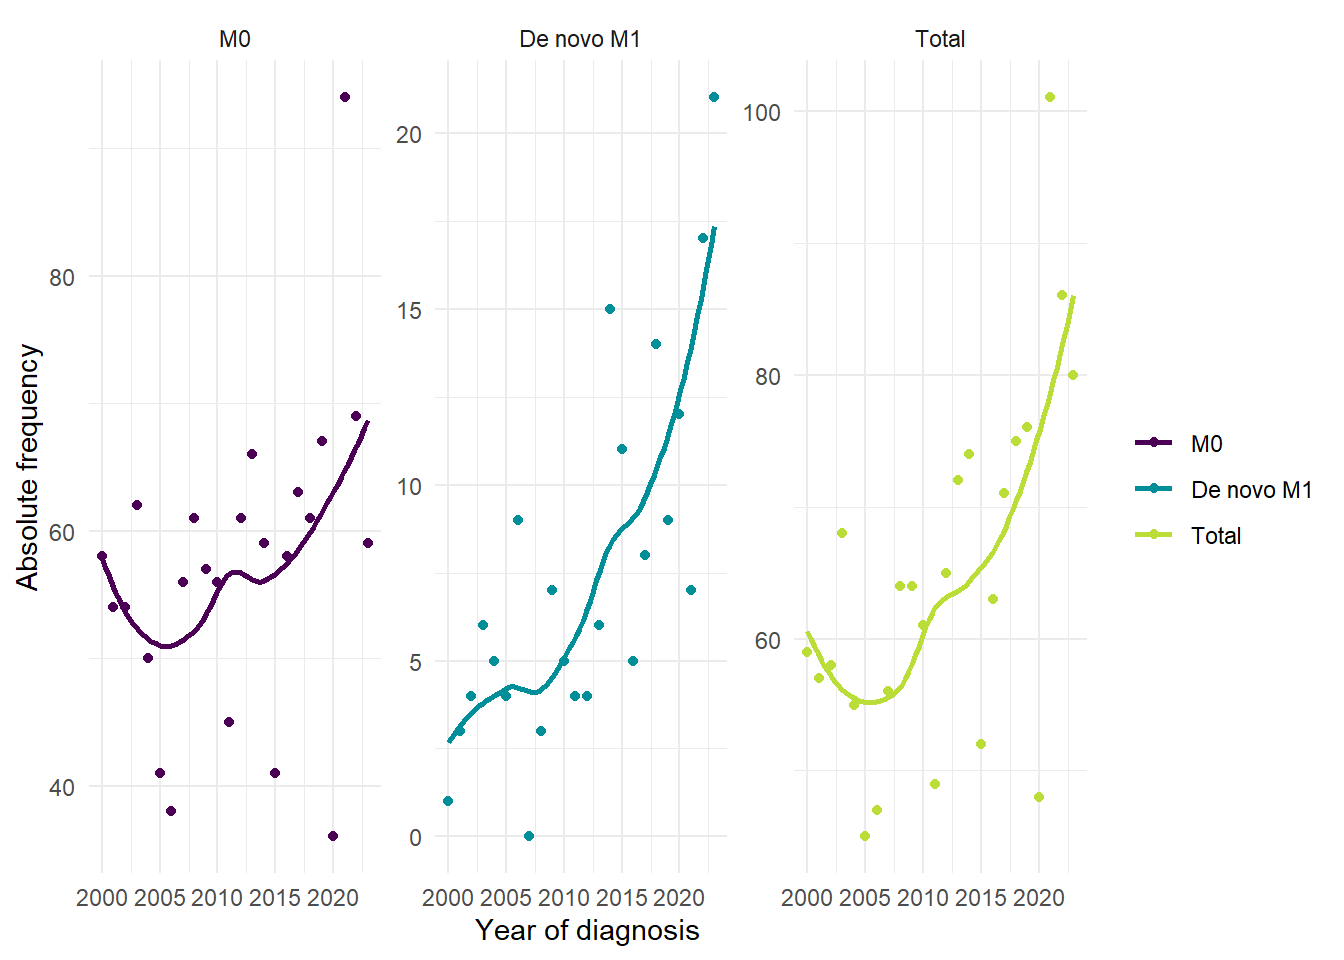
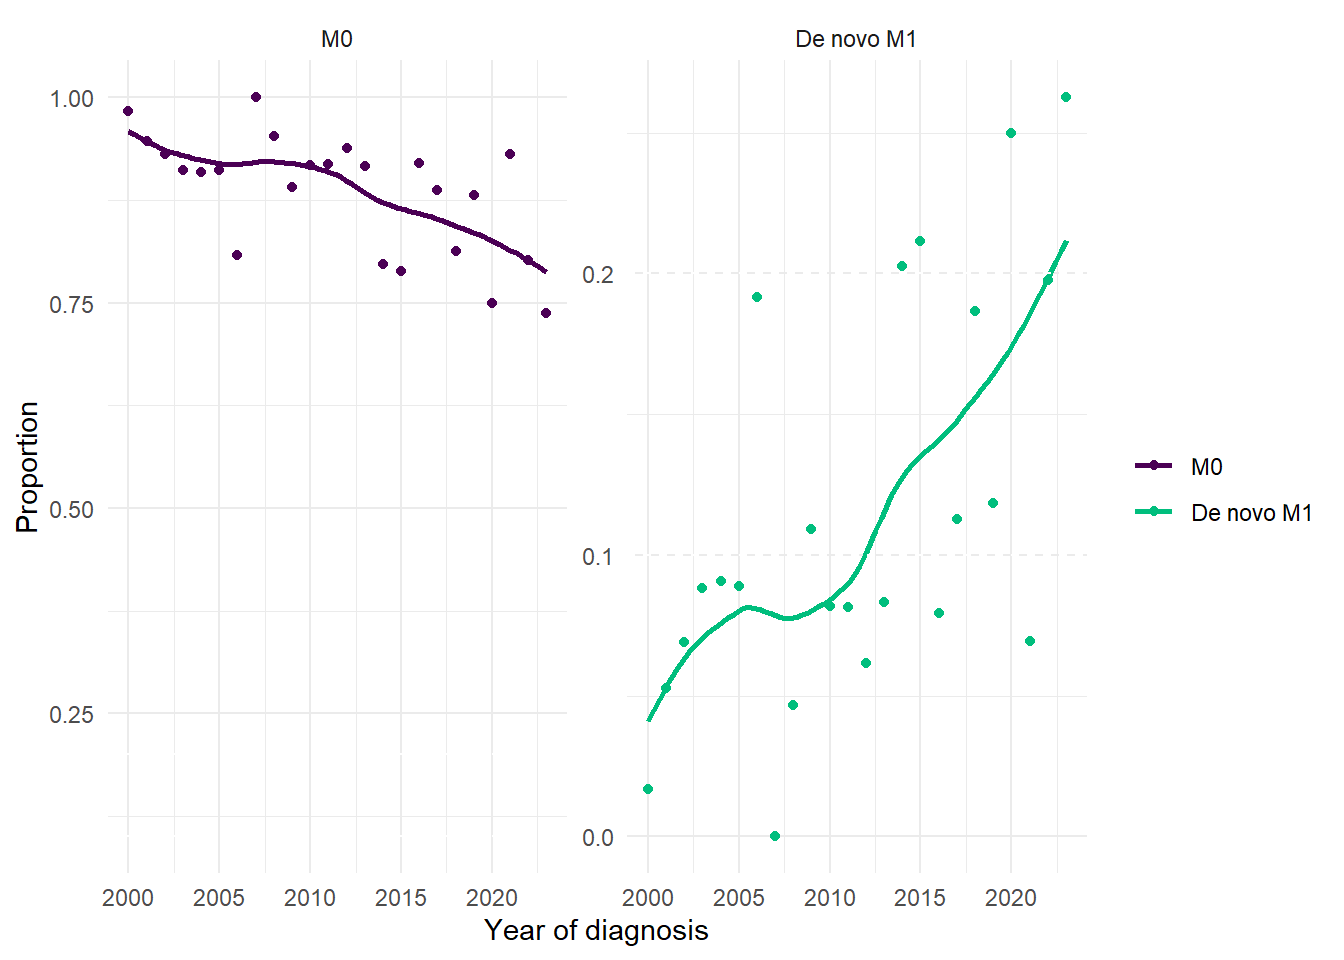
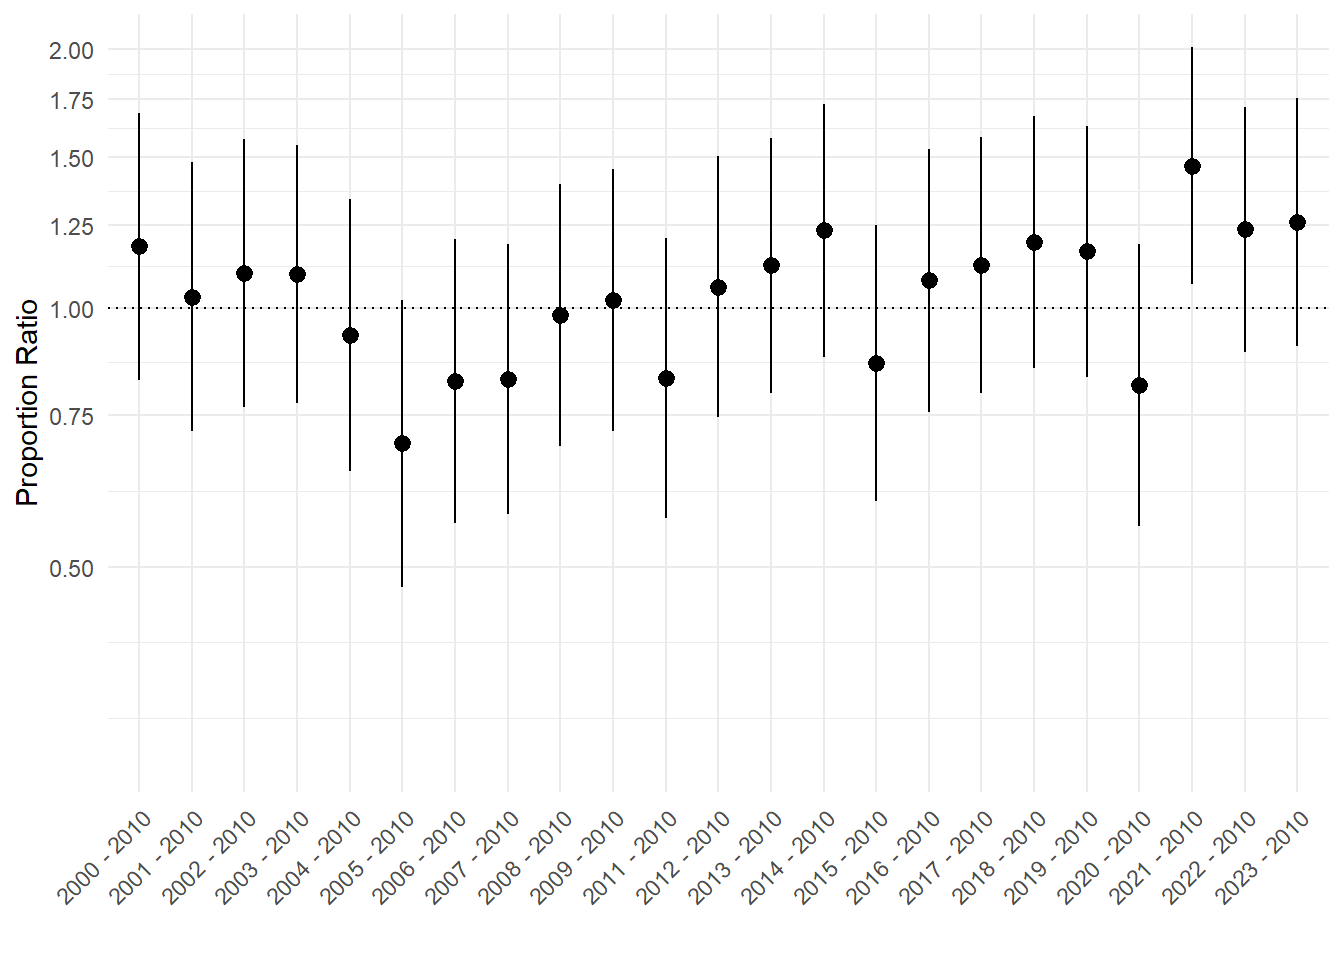
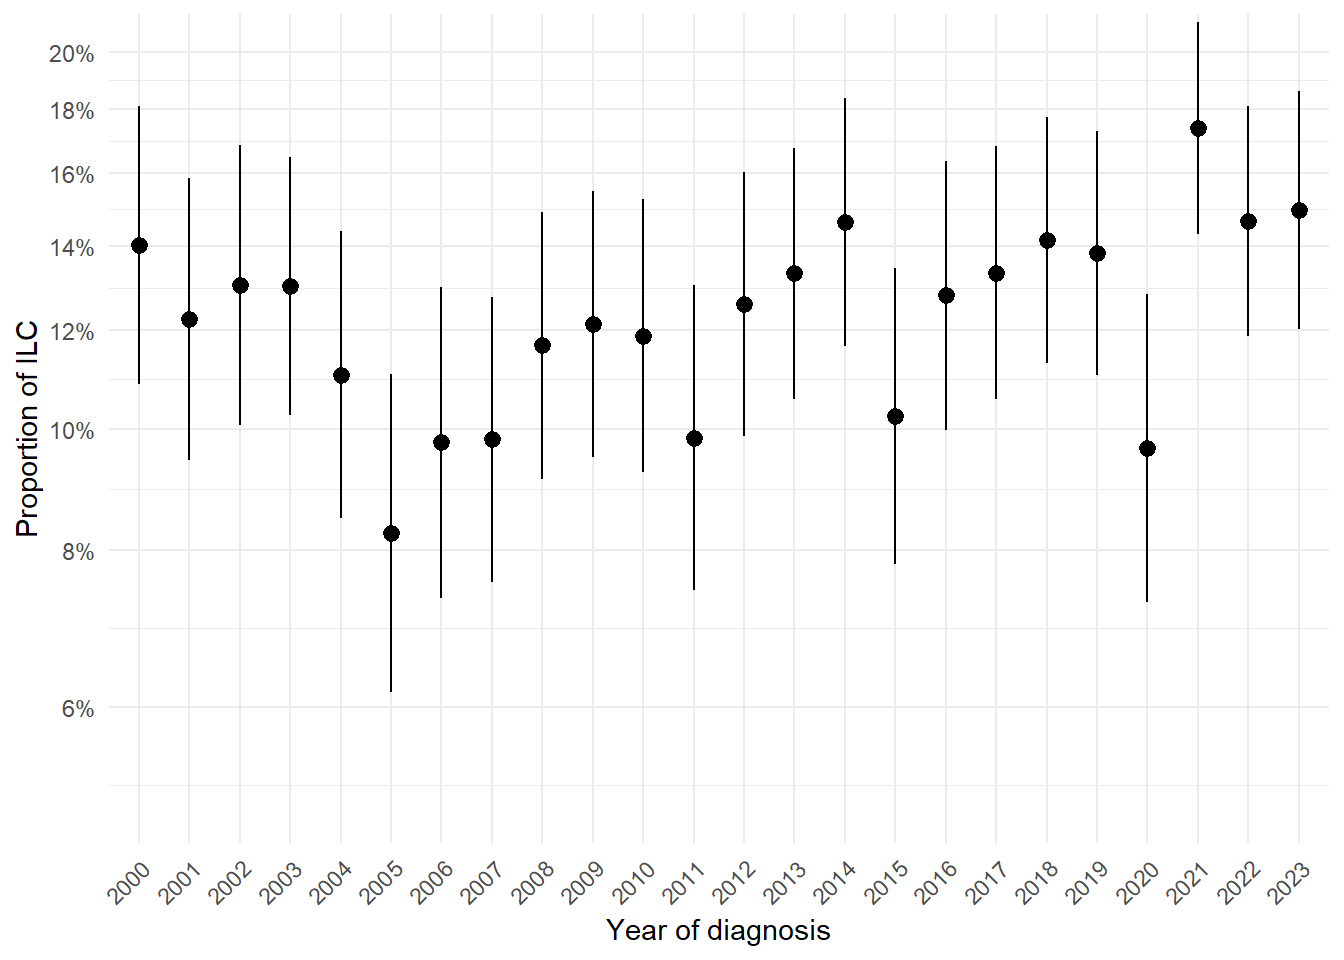
Figure 4.3 shows the proportion ratios for each year when 2010 is considered as the reference along with their 95% confidence intervals. A proportion ratio > 1 indicates that the specific year is associated to an increase in the proportion of cases compared to 2010 and viceversa. Please, note that this confidence intervals are not adjusted for the multiple comparisons. We need to define a method to adjust the confidence intervals. The likelihood ratio test comparing the likelihood of a null model with the model that includes the year of diagnosis indicates is highly significant (p < 0.0001). Figure 4.4 shows the predicted relative proportions of cases for each year along with their 95% Confidence Intervals.
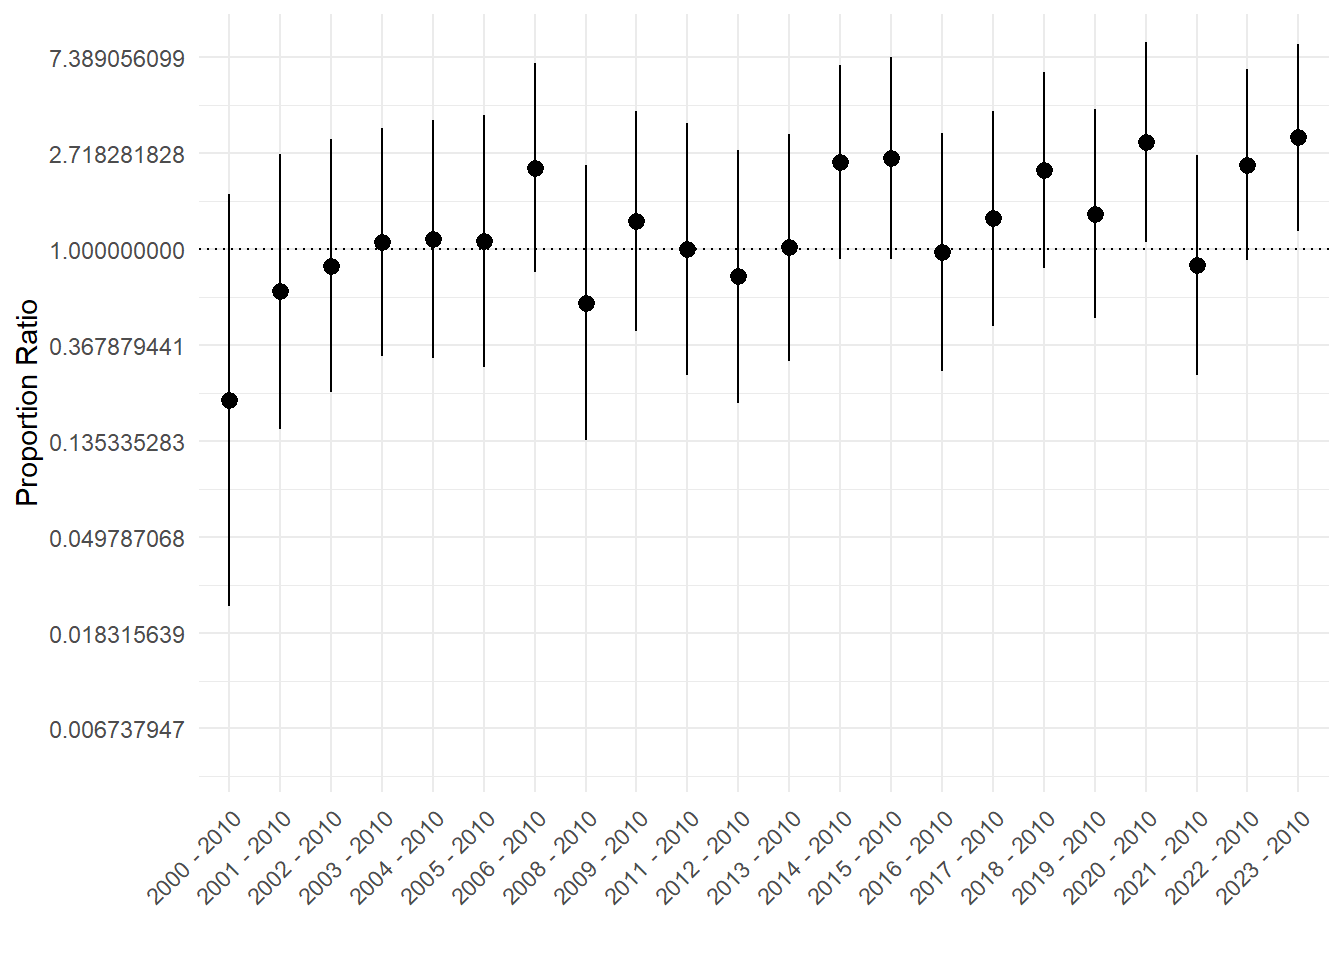
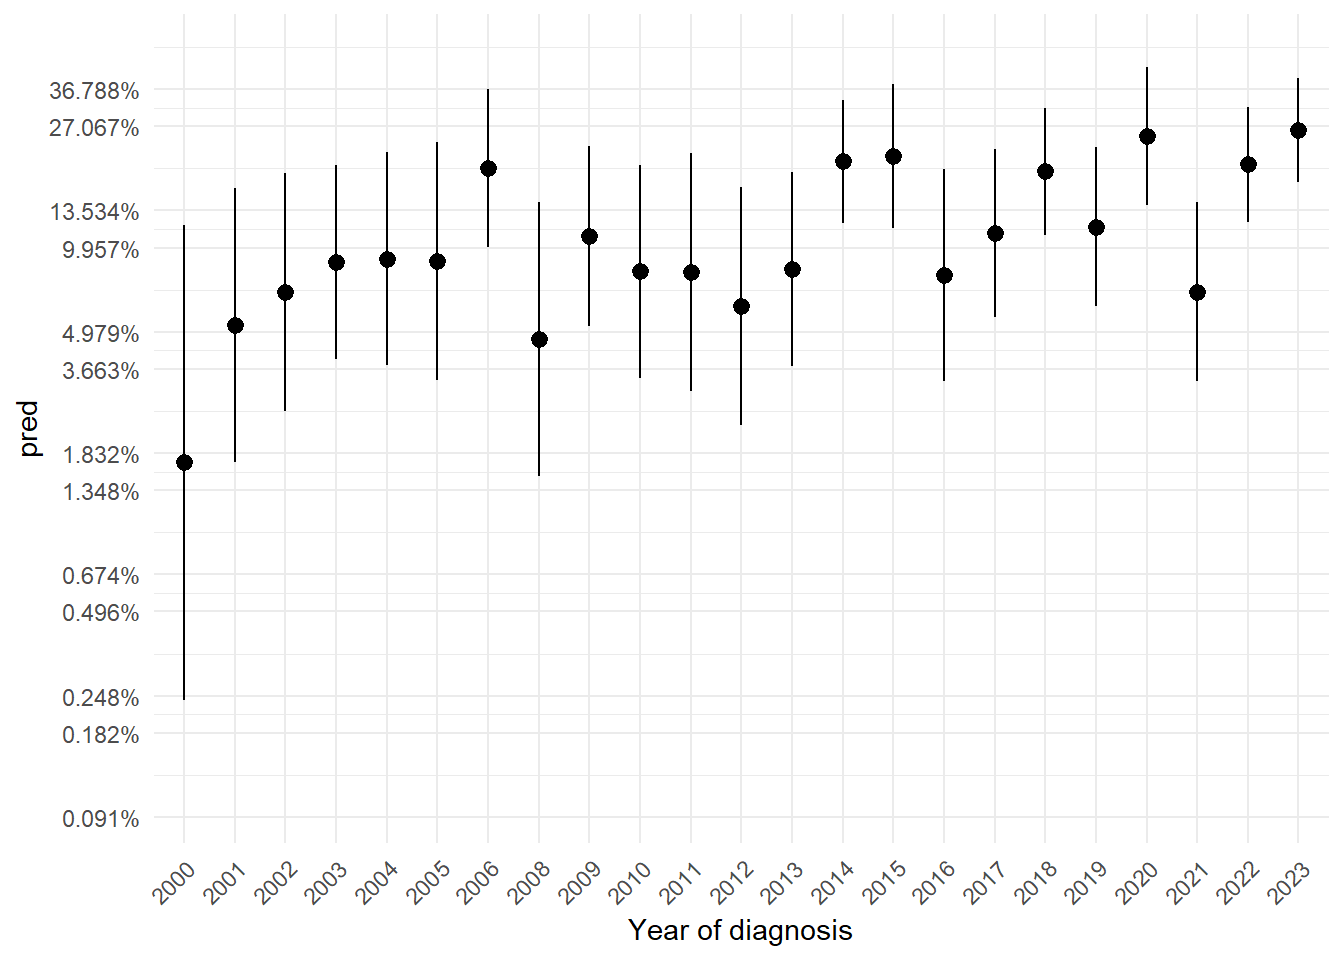
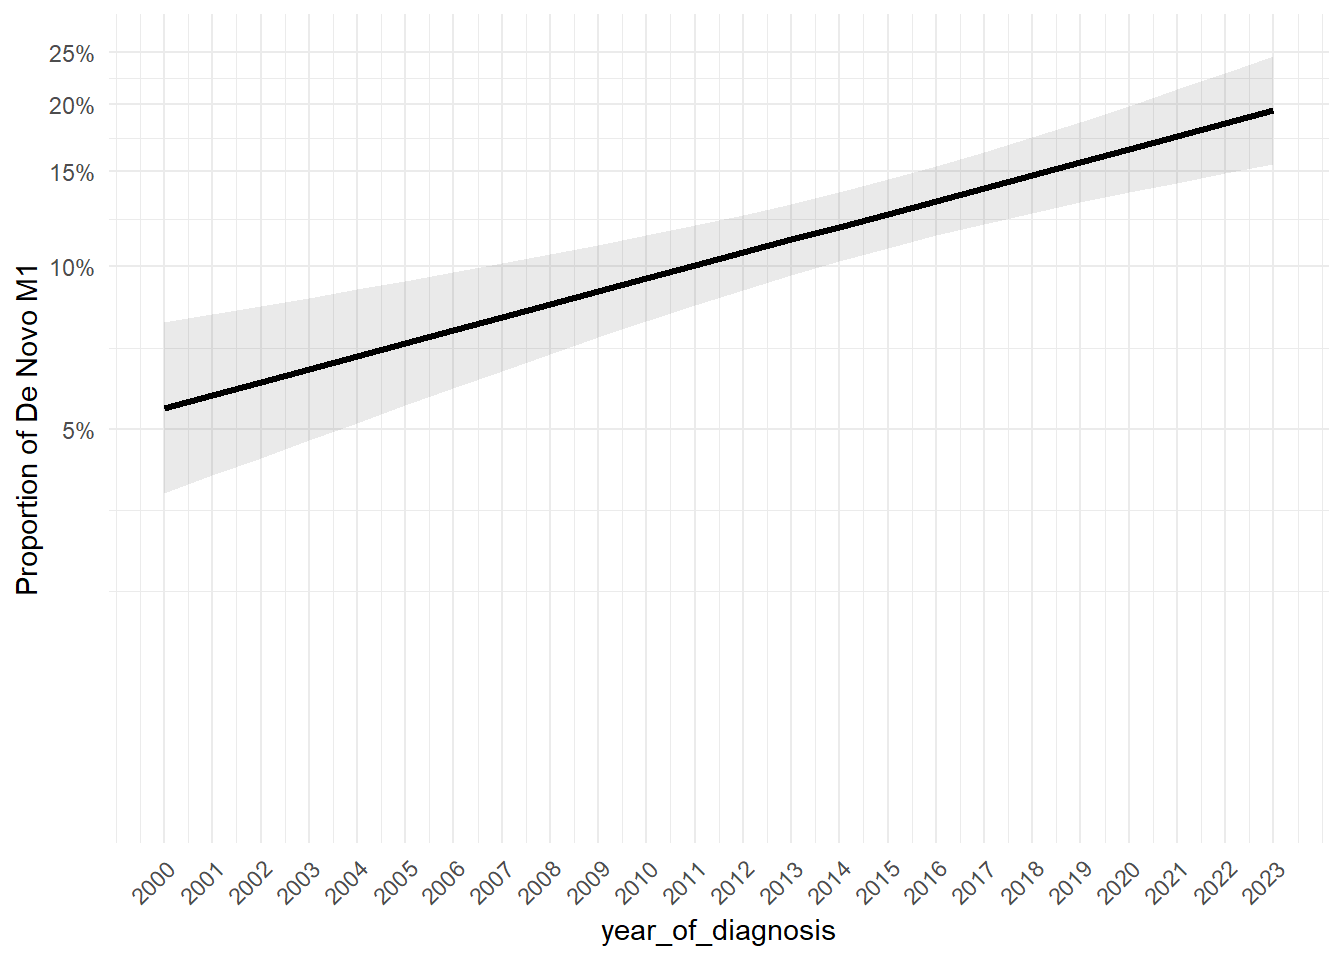
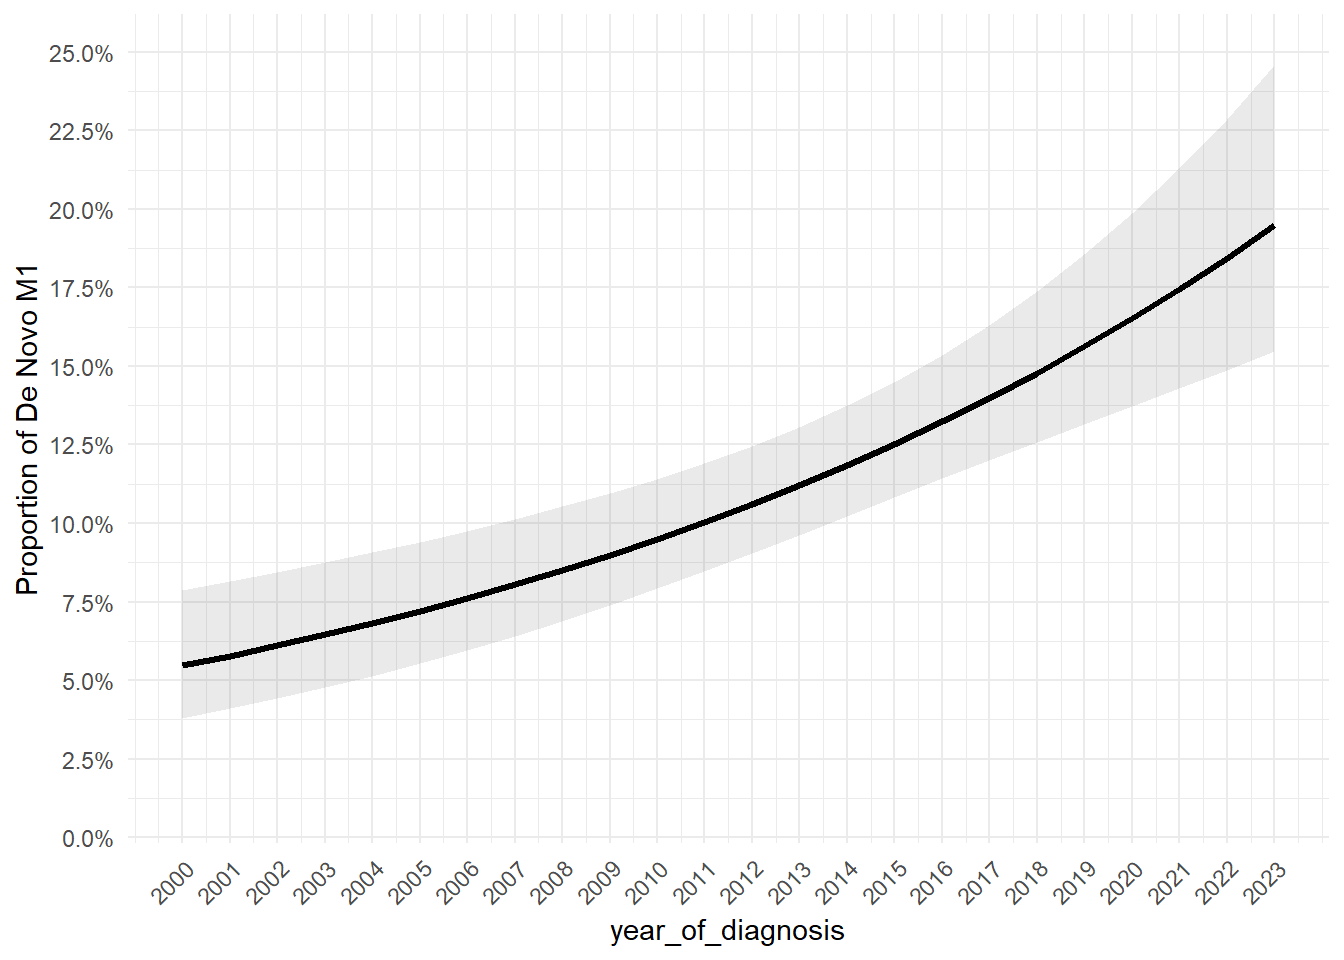
Figure 4.5 and Figure 4.6 show the predicted proportion of cases as a smooth function of the years of diagnosis. The trend identified is basically linear on the log scale (Figure 4.5) and non-linear considering the response scale (Figure 4.6).
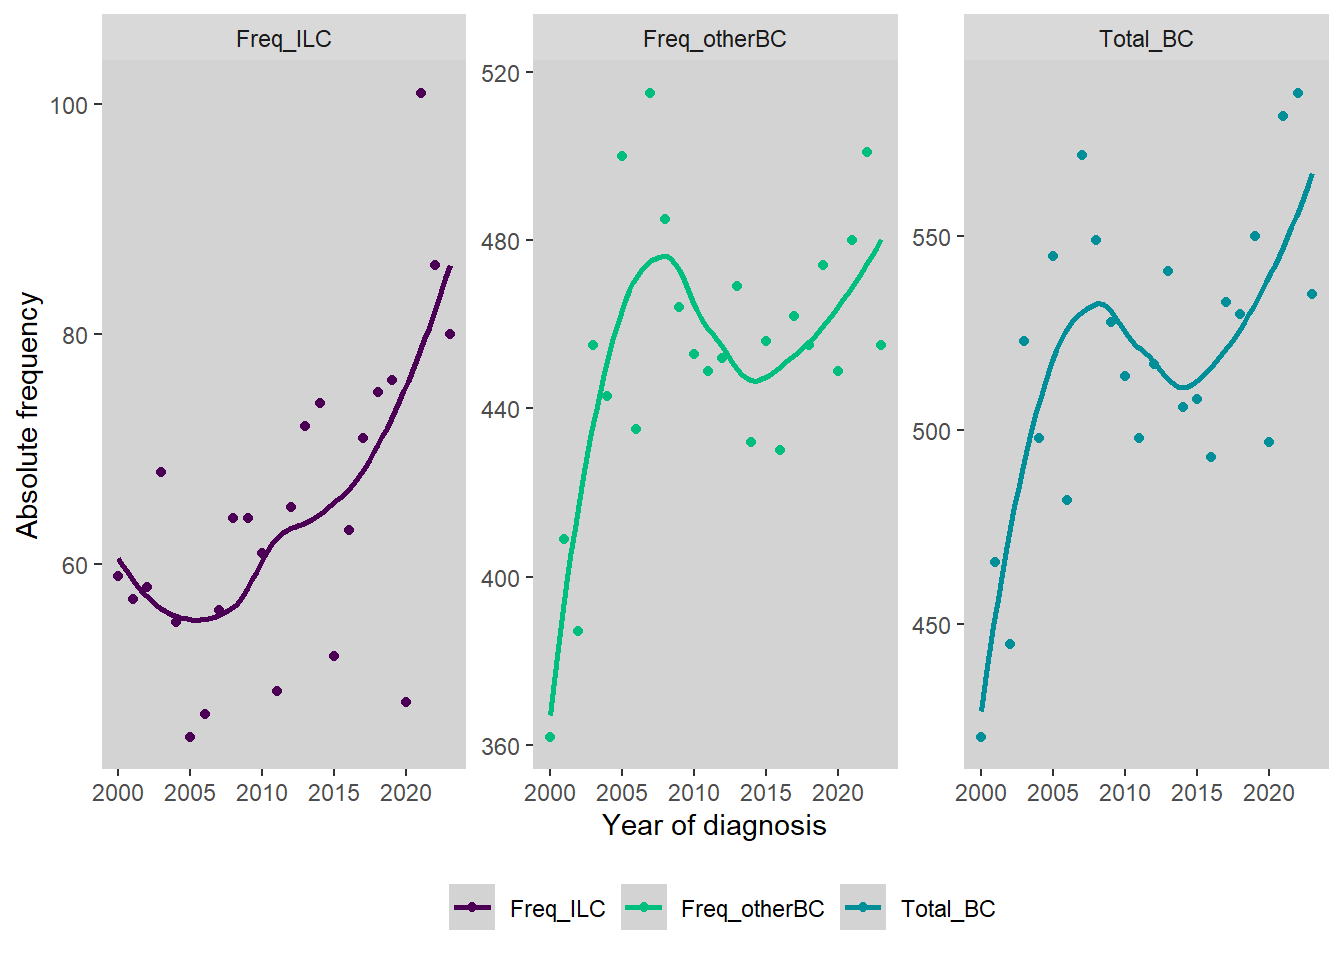
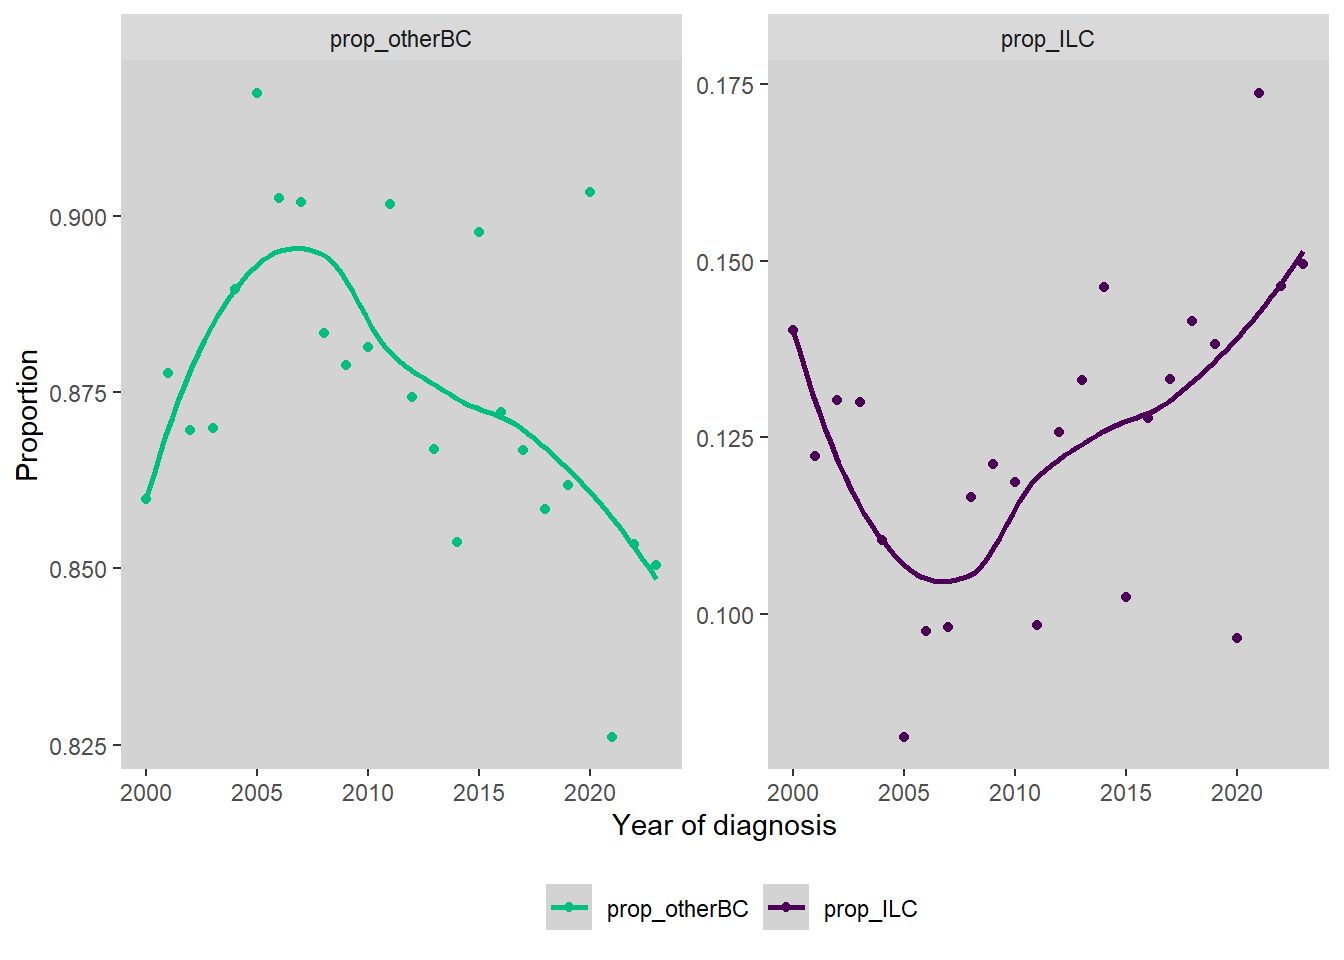
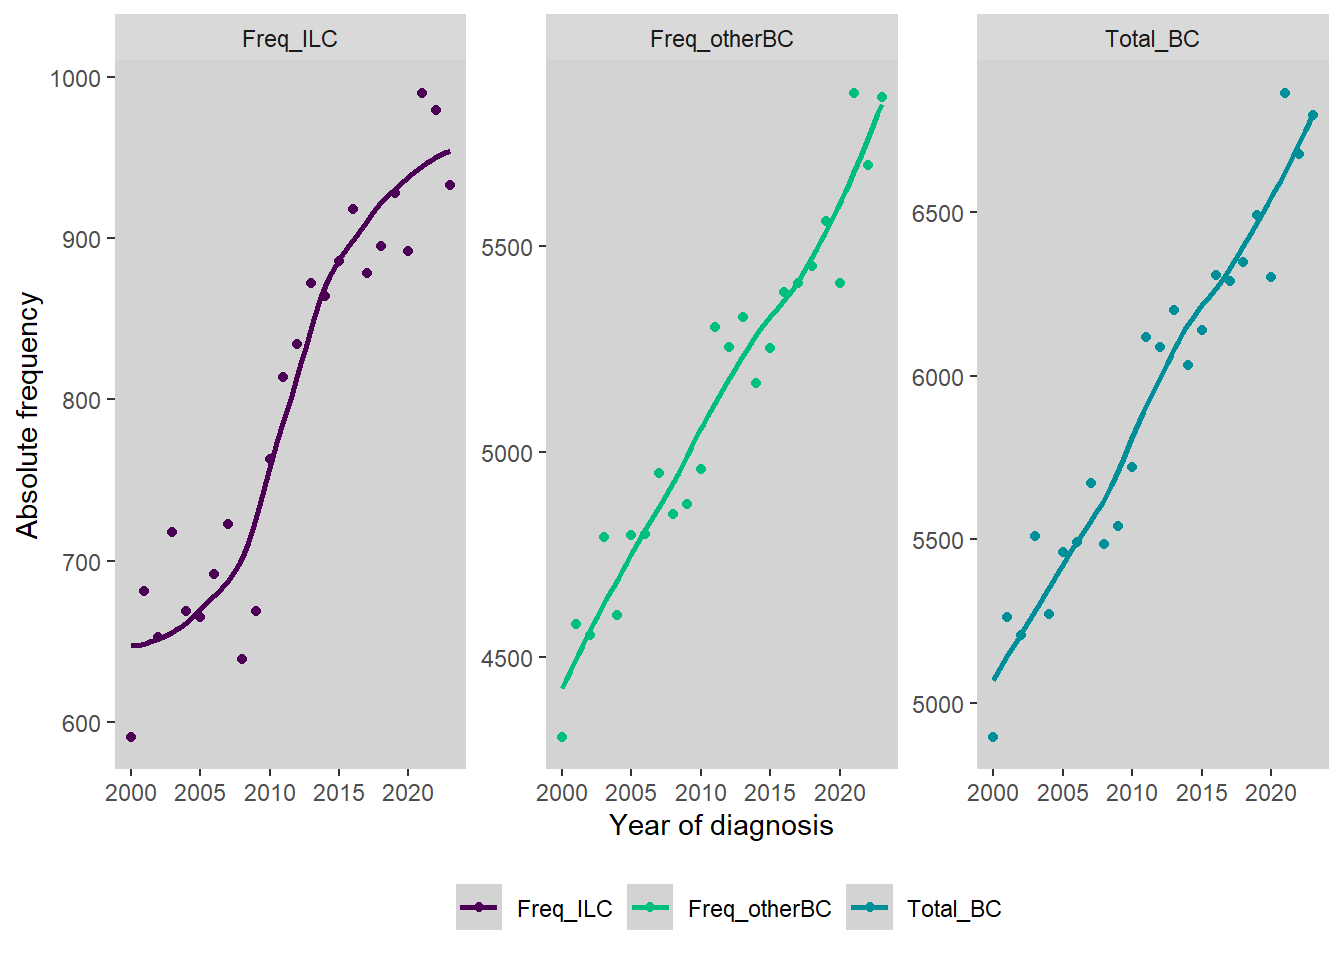
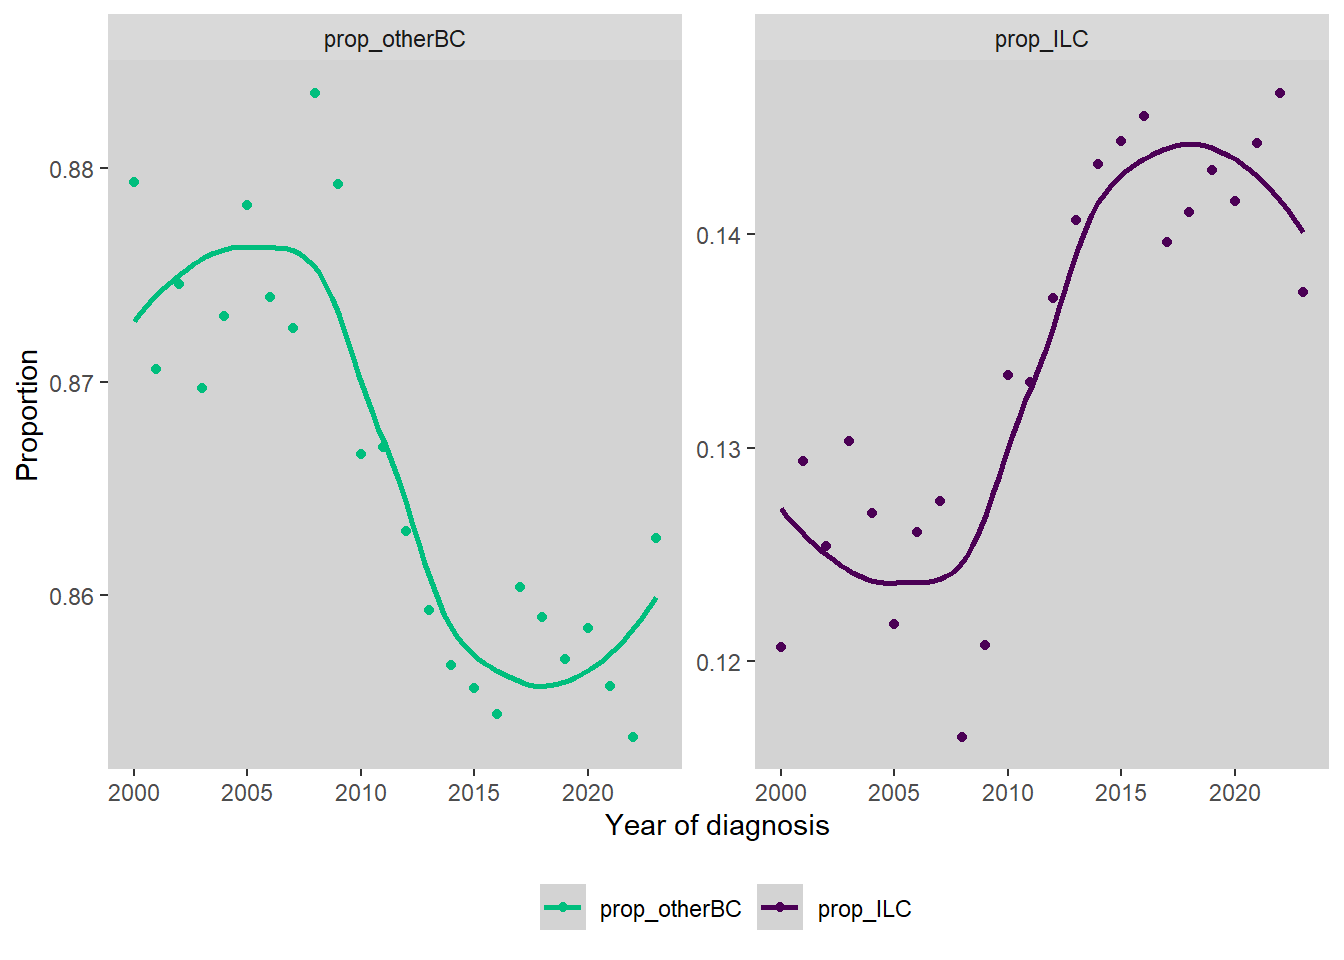
We then analyse the proportion of ILC over the total BC diagnoses in UZ Leuven. Figure 4.7 shows the raw number of ILC and Other BC diagnoses and total diagnoses for each year between 2000 and 2023. Figure 4.8 shows the raw proportions of cases for each years. For both the representation, a LOESS smoother is applied to identify a general trend. Overall, the absolute number of ILC diagnoses remains stable between 2000 and 2005, to sharply increase after 2005. ON the other hand, the absolute number of other BC diagnoses sharply increases in the period 2000-2005 to then decrease and then increase again, over the years. The other BC trend affects the proportion of ILC trend in the period 2000-2005, which seems to decrease sharply in that period. This however is not related to a decrease in the frequency of ILC diagnoses but more to a sharply increase in the other BC diagnoses.
Also in this case, the likelihood ratio test resulted significant (p = 0.002). Figure 4.9 shows the proportion ratios for each year when 2010 is considered as the reference along with their 95% confidence intervals. Figure 4.10 shows the predicted relative proportions of cases for each year along with their 95% Confidence Intervals.
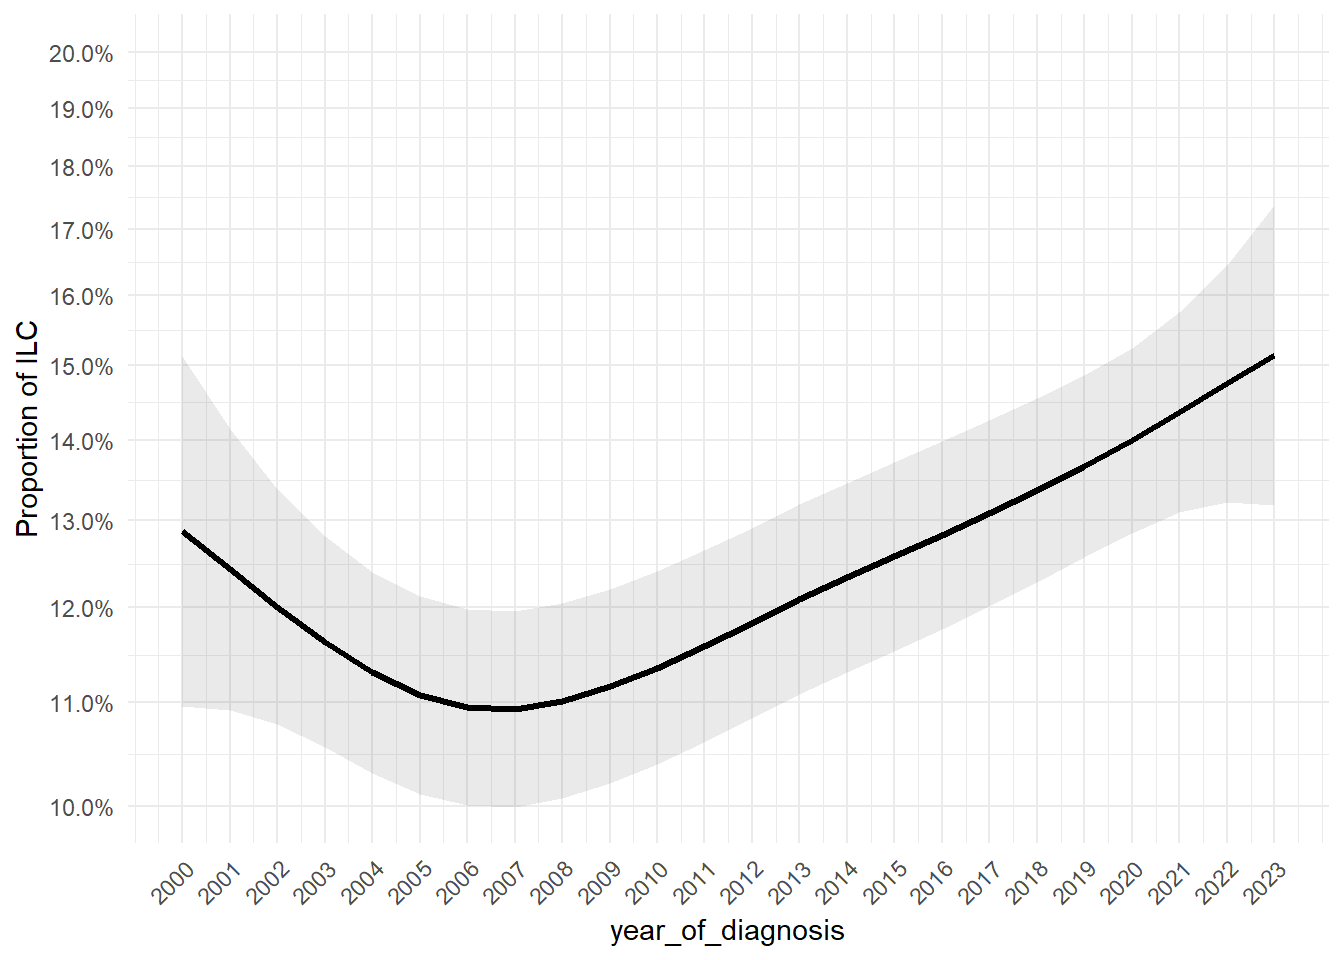
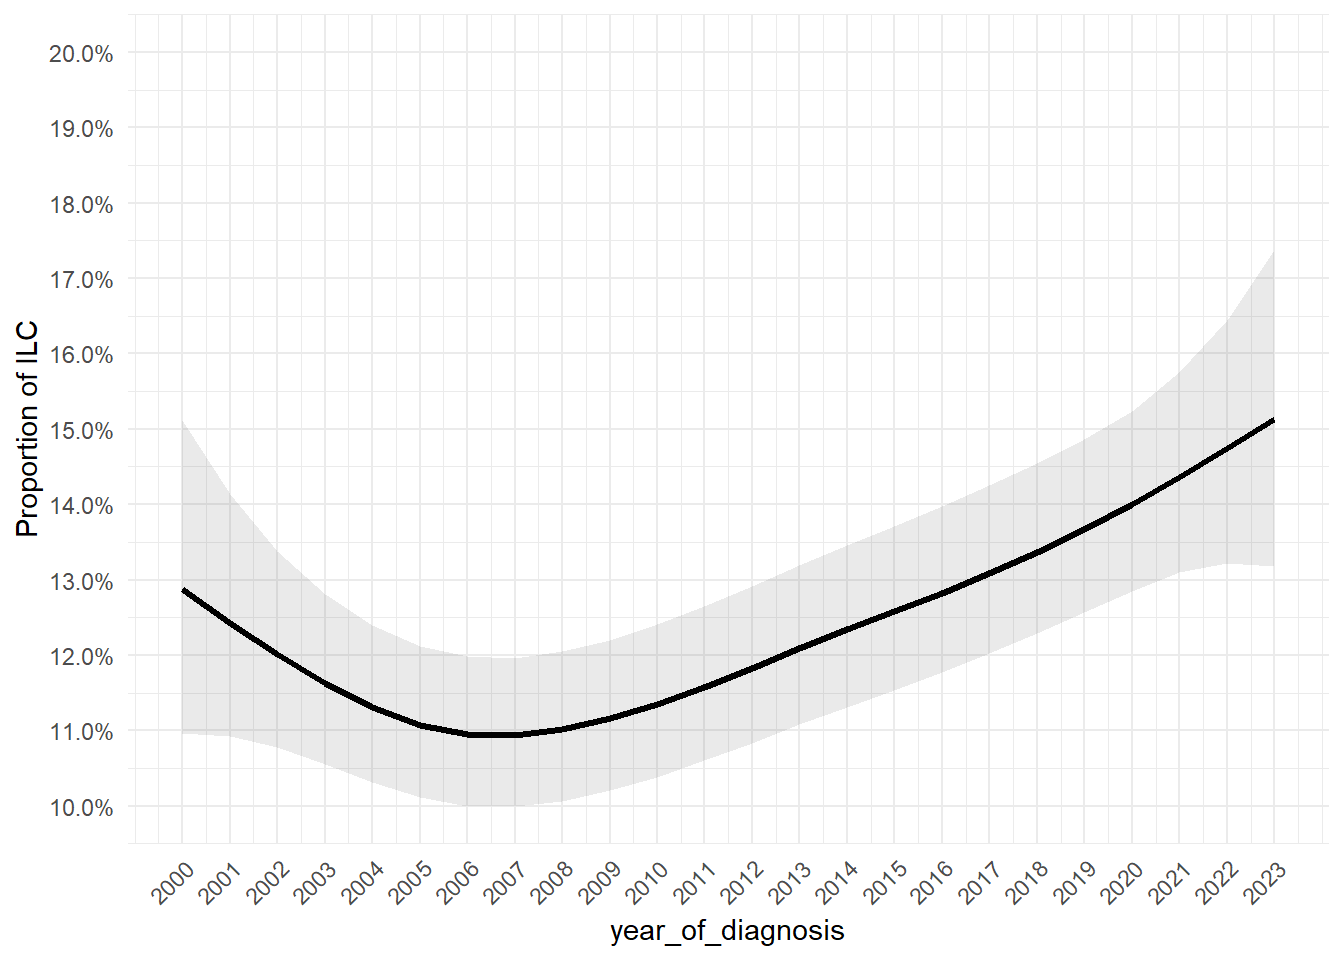
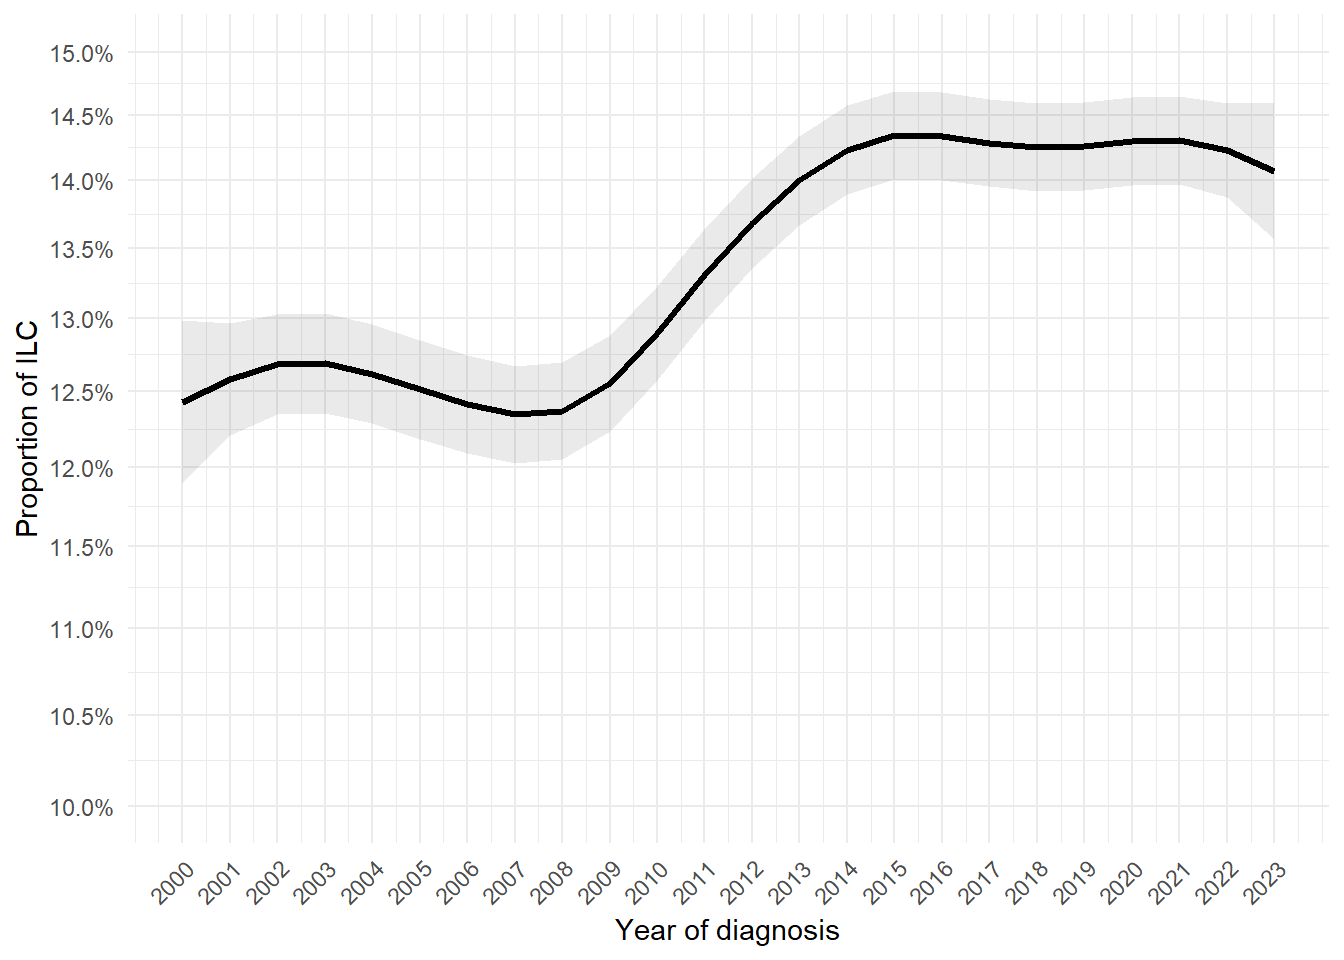
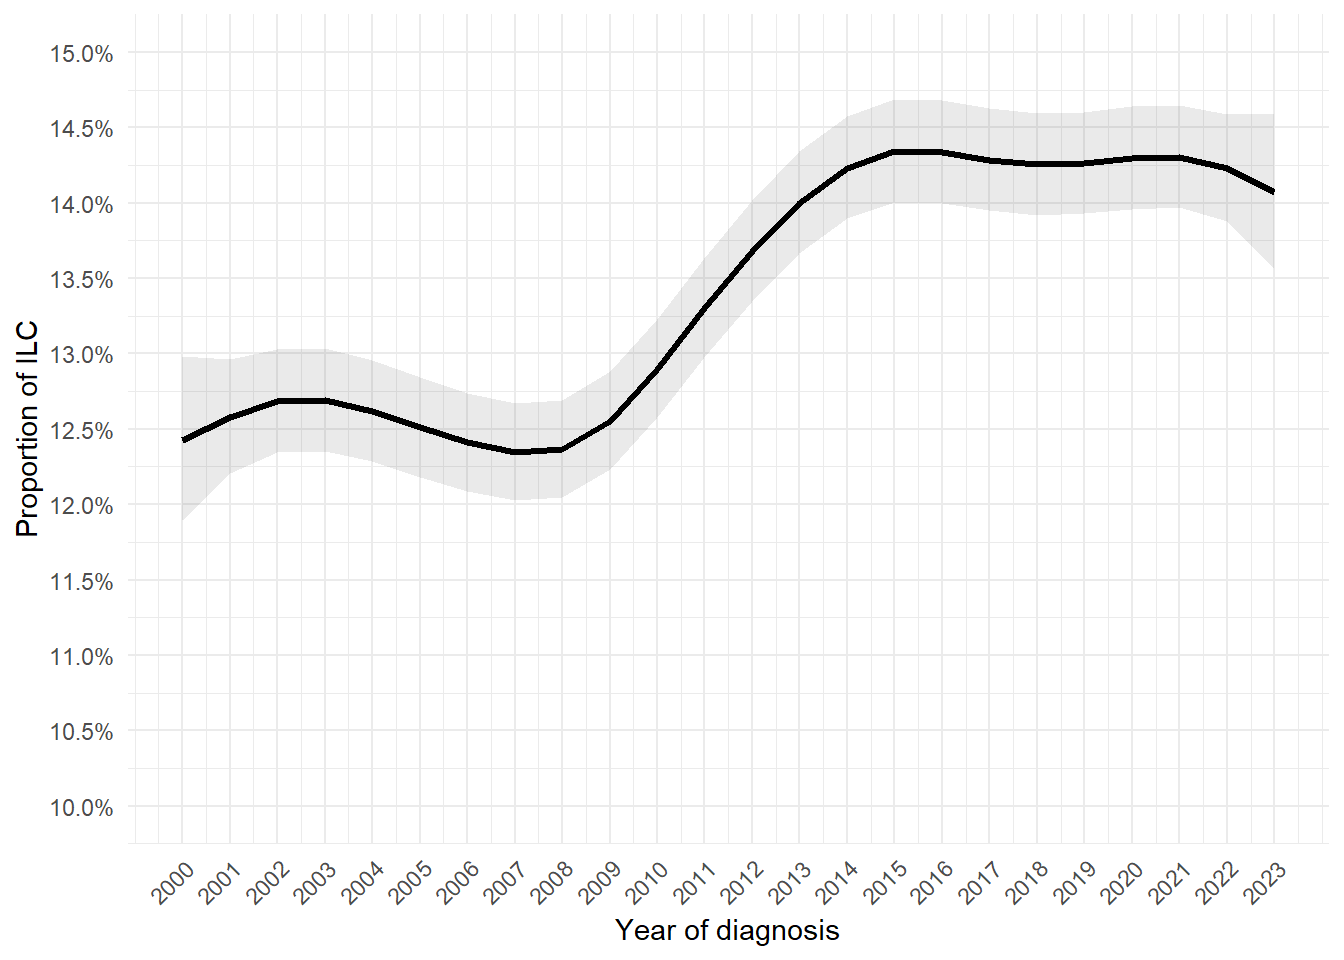
Figure 4.11 and Figure 4.12 show the predicted proportion of cases as a smooth function of the years of diagnosis. The trend identified is non-linear both on the log scale (Figure 4.11) and on the response scale (Figure 4.12).
Now we will analyze data from breast cancer registries to see whether the results found in the analysis of UZ Leuven data are in line with the general BC population in Belgium and in the Flanders.
Figure 4.13 shows the raw number of M0 and De Novo M1 and total diagnoses for each year between 2004 and 2023. Figure 4.14 shows the raw proportions of cases for each years. For both the representation, a LOESS smoother is applied to identify a general trend. Overall, both the absolute number of M0 and M1 diagnoses seems to increase over the years. However, the proportion of De Novo M1 seems to increase why the proportion of M0 decreases over time.
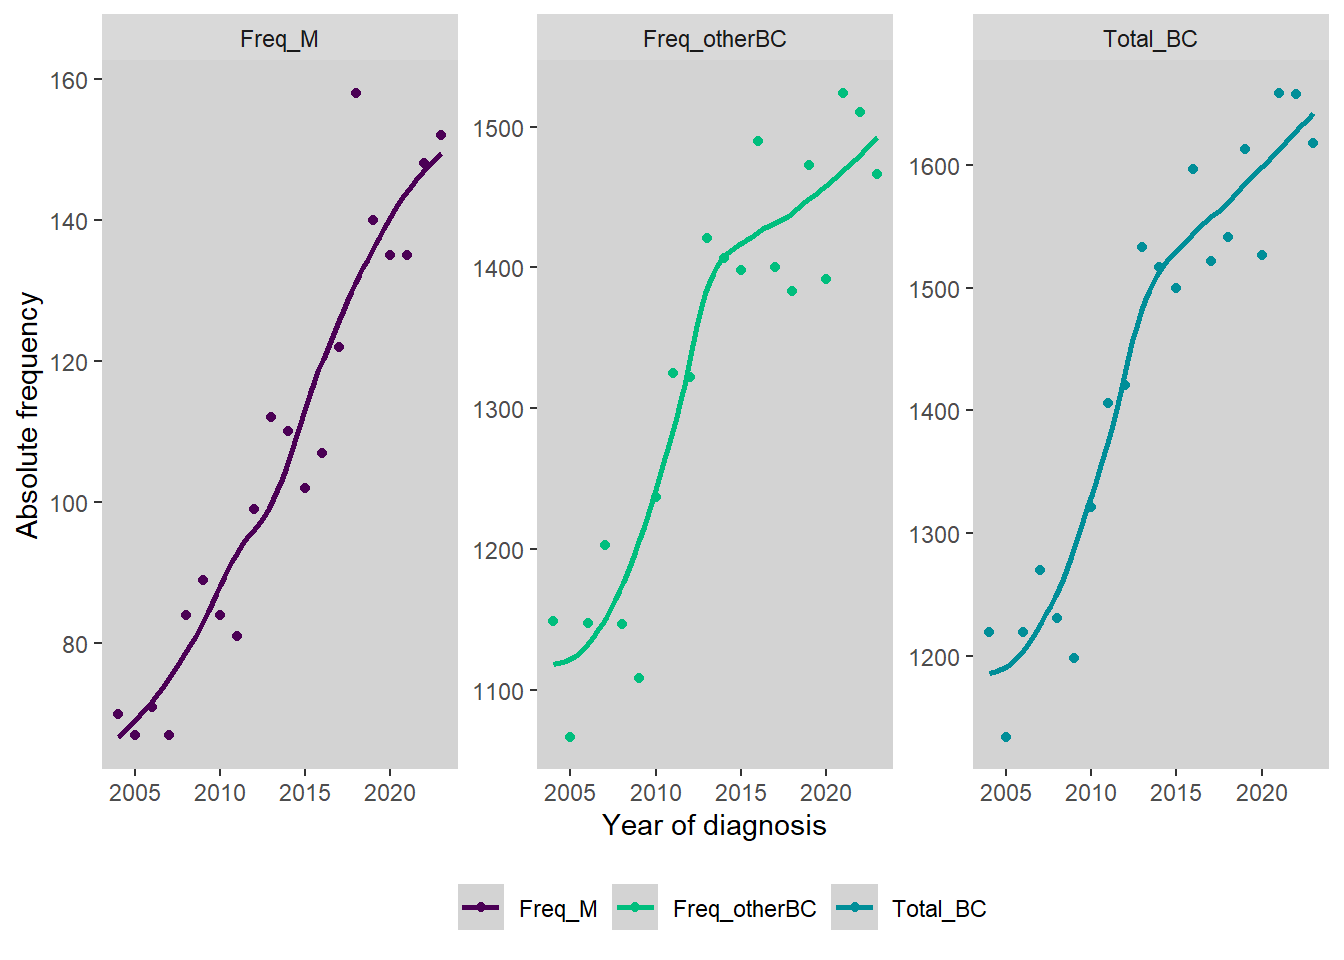
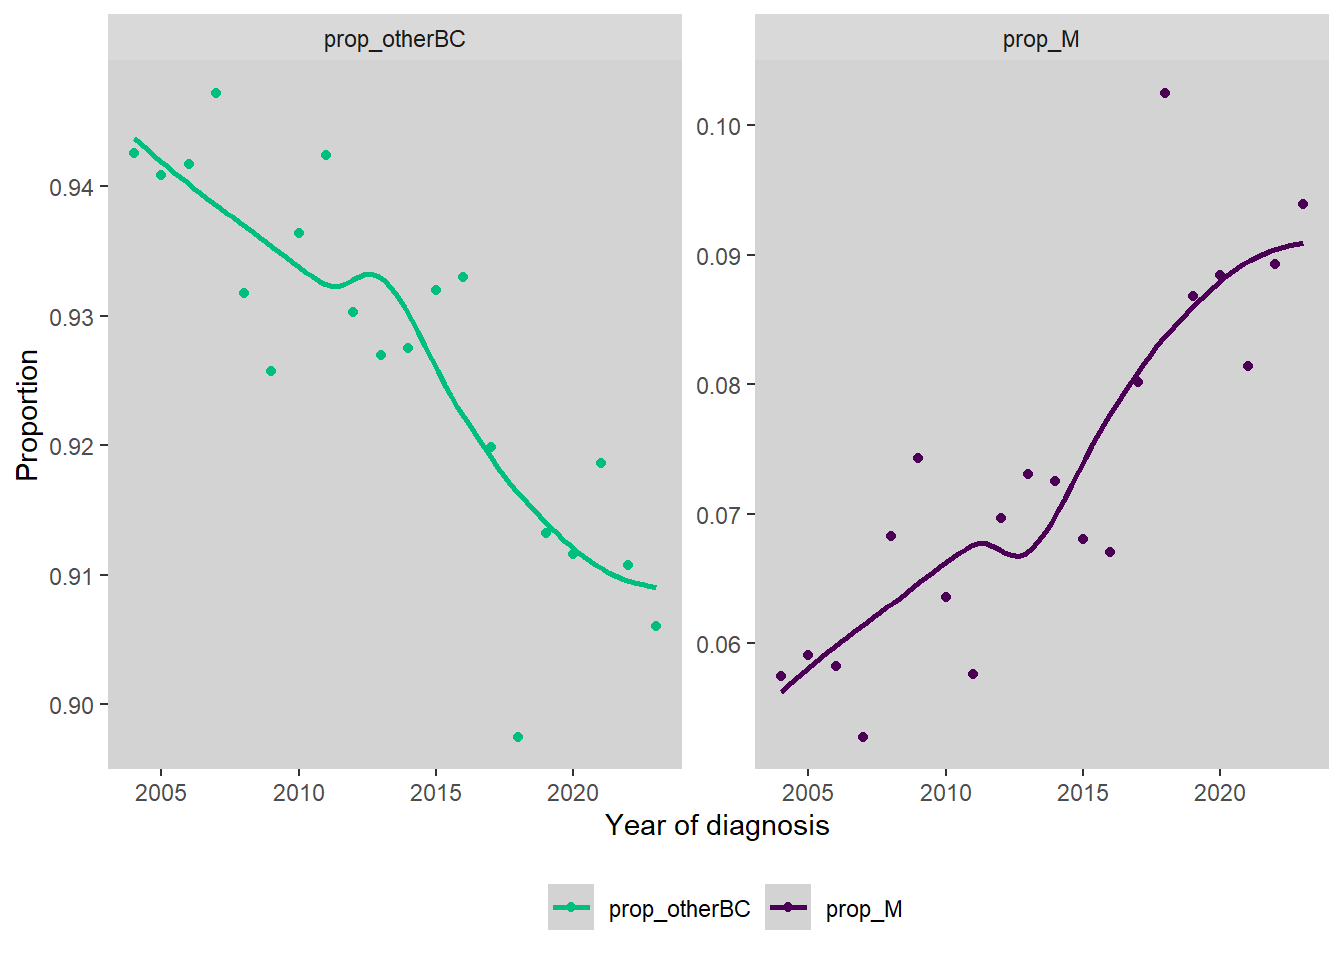
Figure 4.15 shows the proportion ratios for each year when 2010 is considered as the reference along with their 95% confidence intervals. The likelihood ratio test comparing the likelihood of a null model with the model that includes the year of diagnosis indicates is highly significant (p < 0.001). Figure 4.16 shows the predicted relative proportions of cases for each year along with their 95% Confidence Intervals.
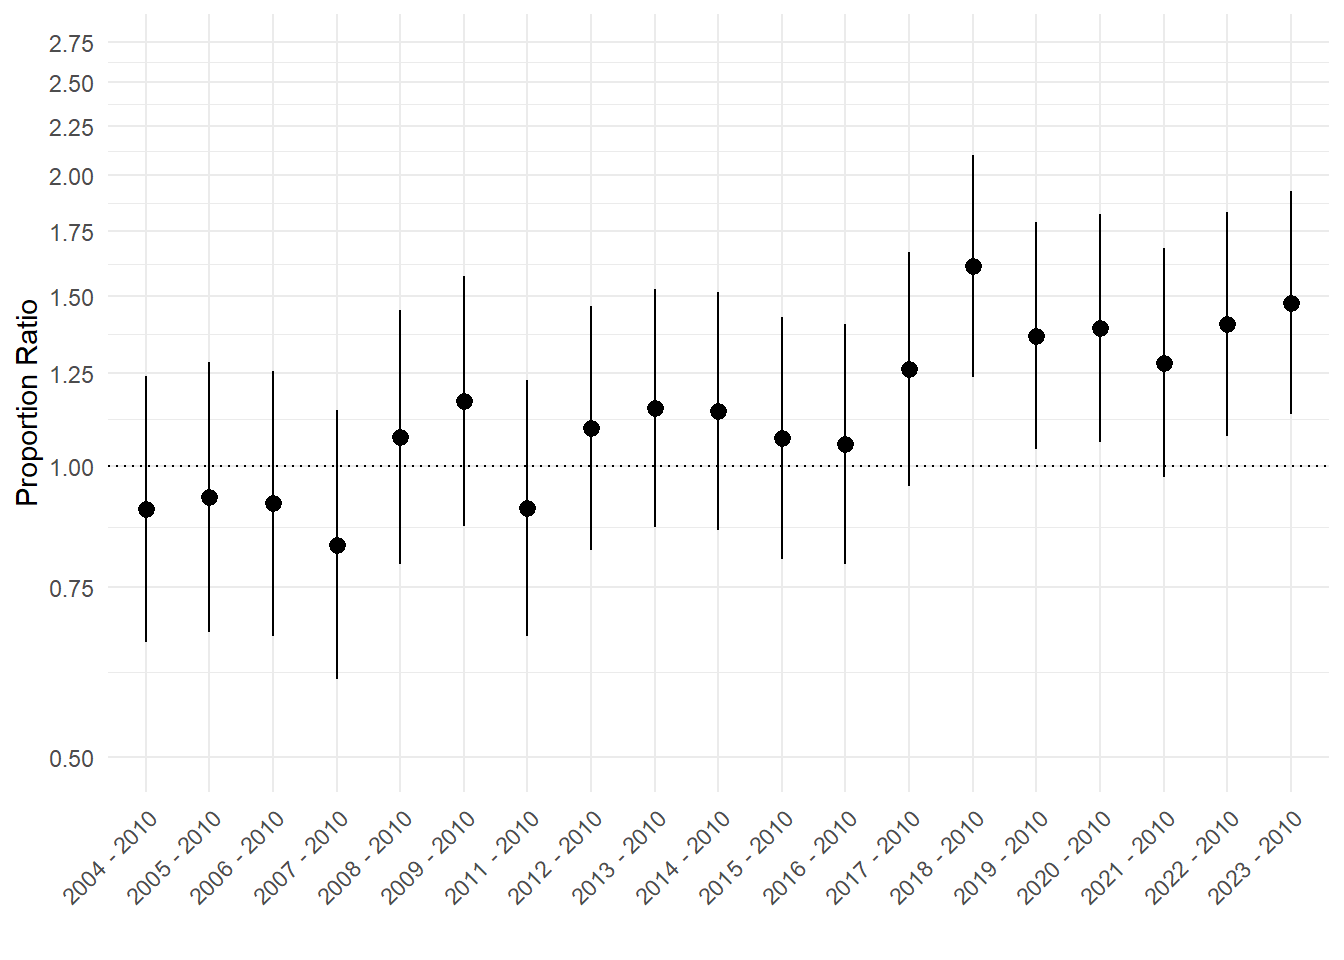
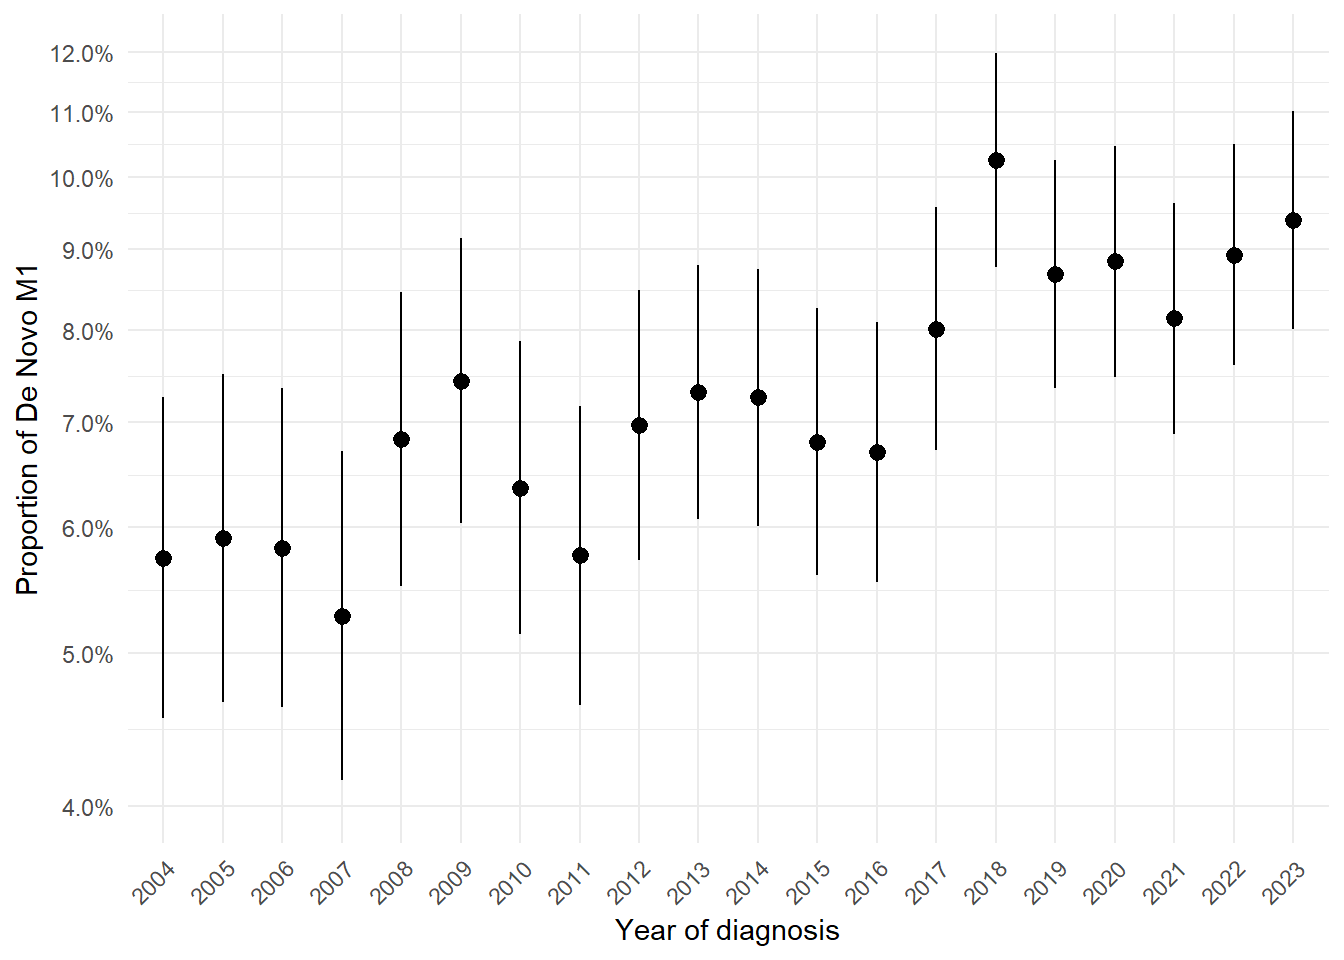
Figure 4.17 and Figure 4.18 show the predicted proportion of cases as a smooth function of the years of diagnosis. The trend identified is basically linear on the log scale (Figure 4.17) and non-linear considering the response scale (Figure 4.18).
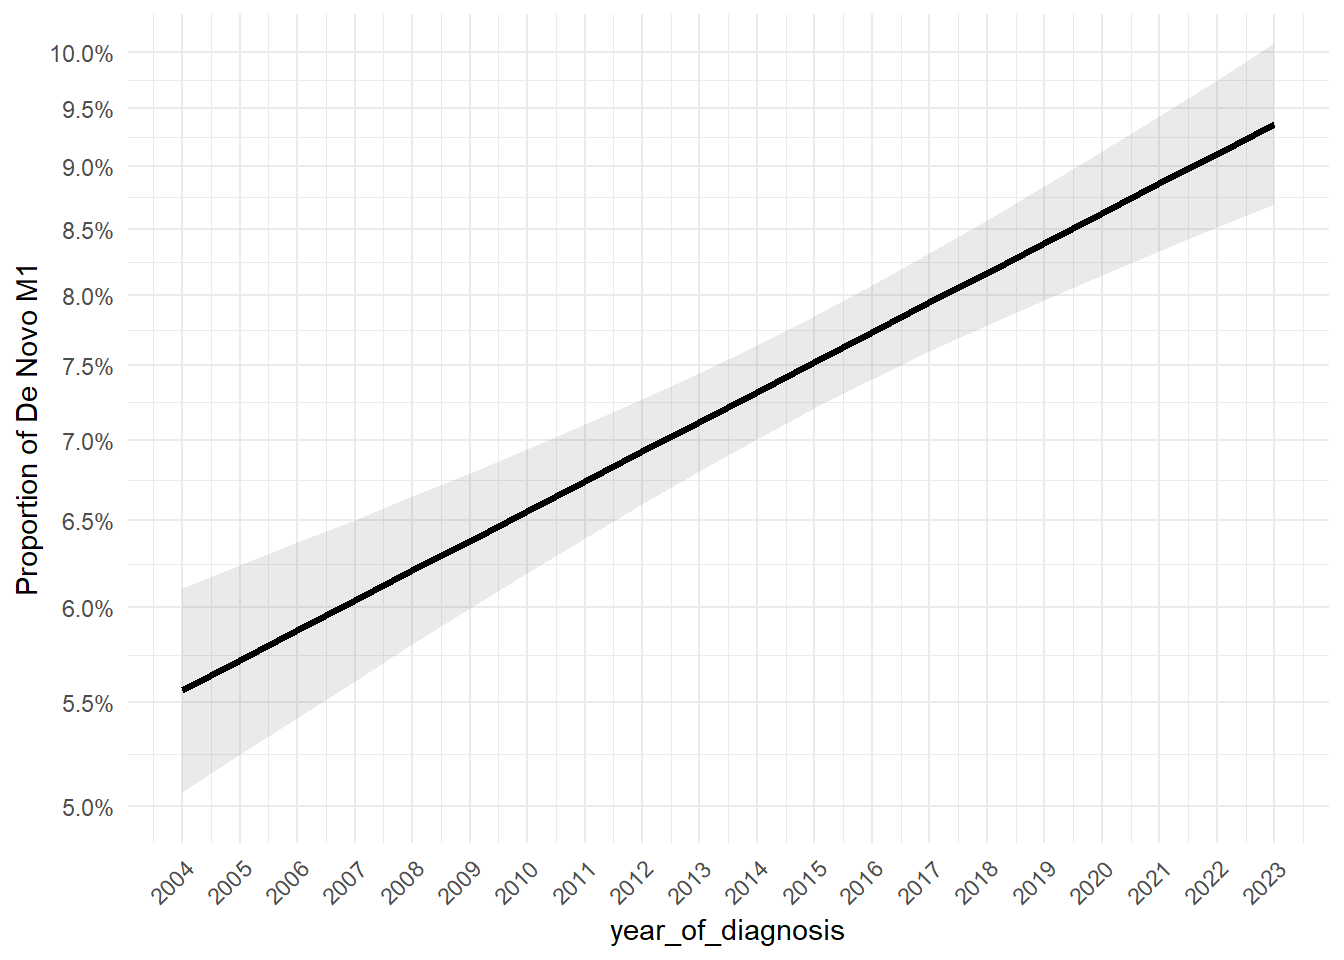
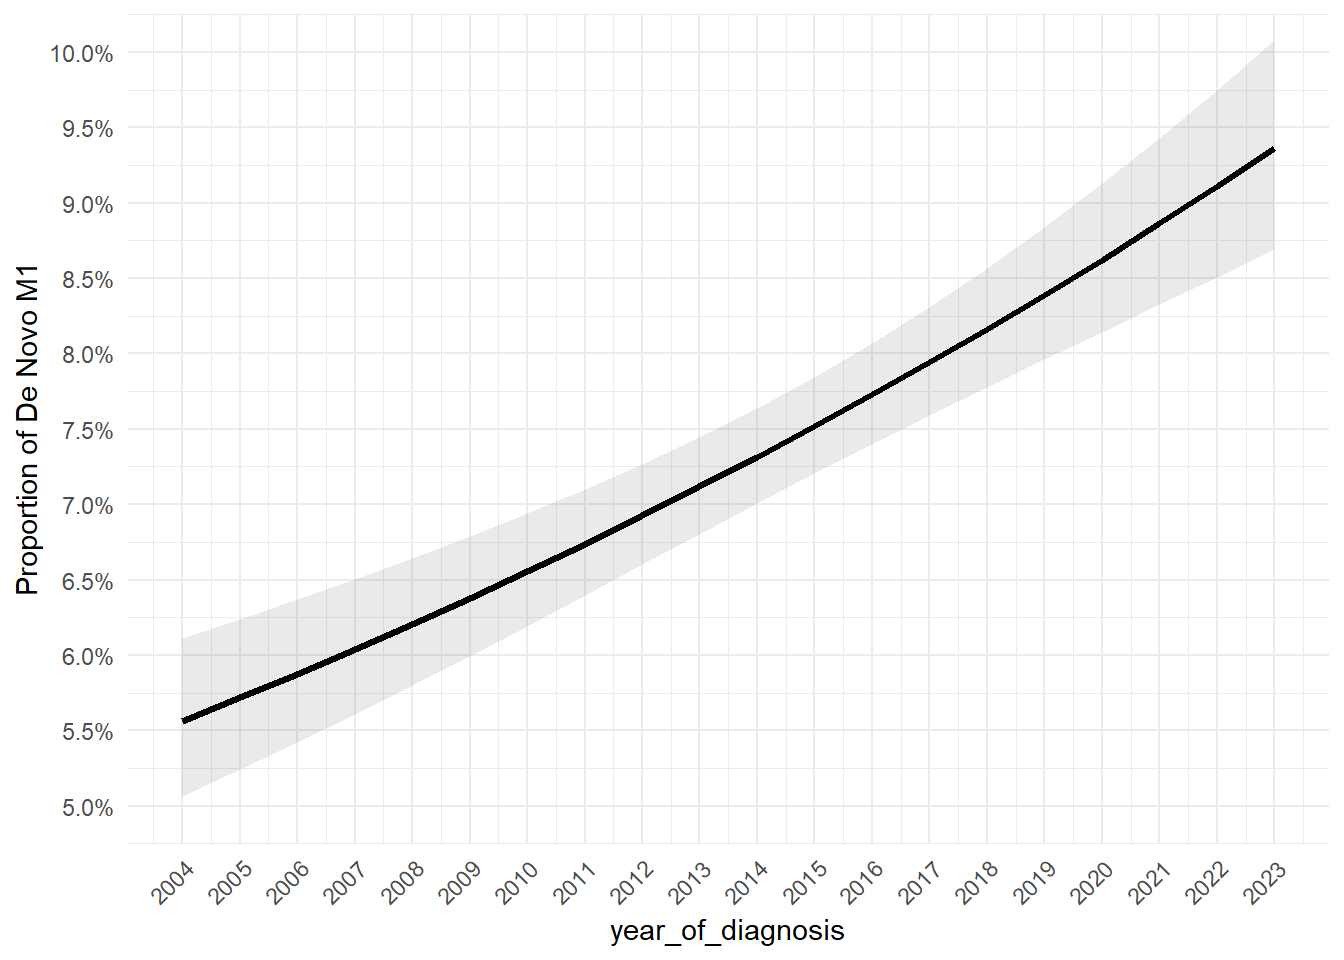
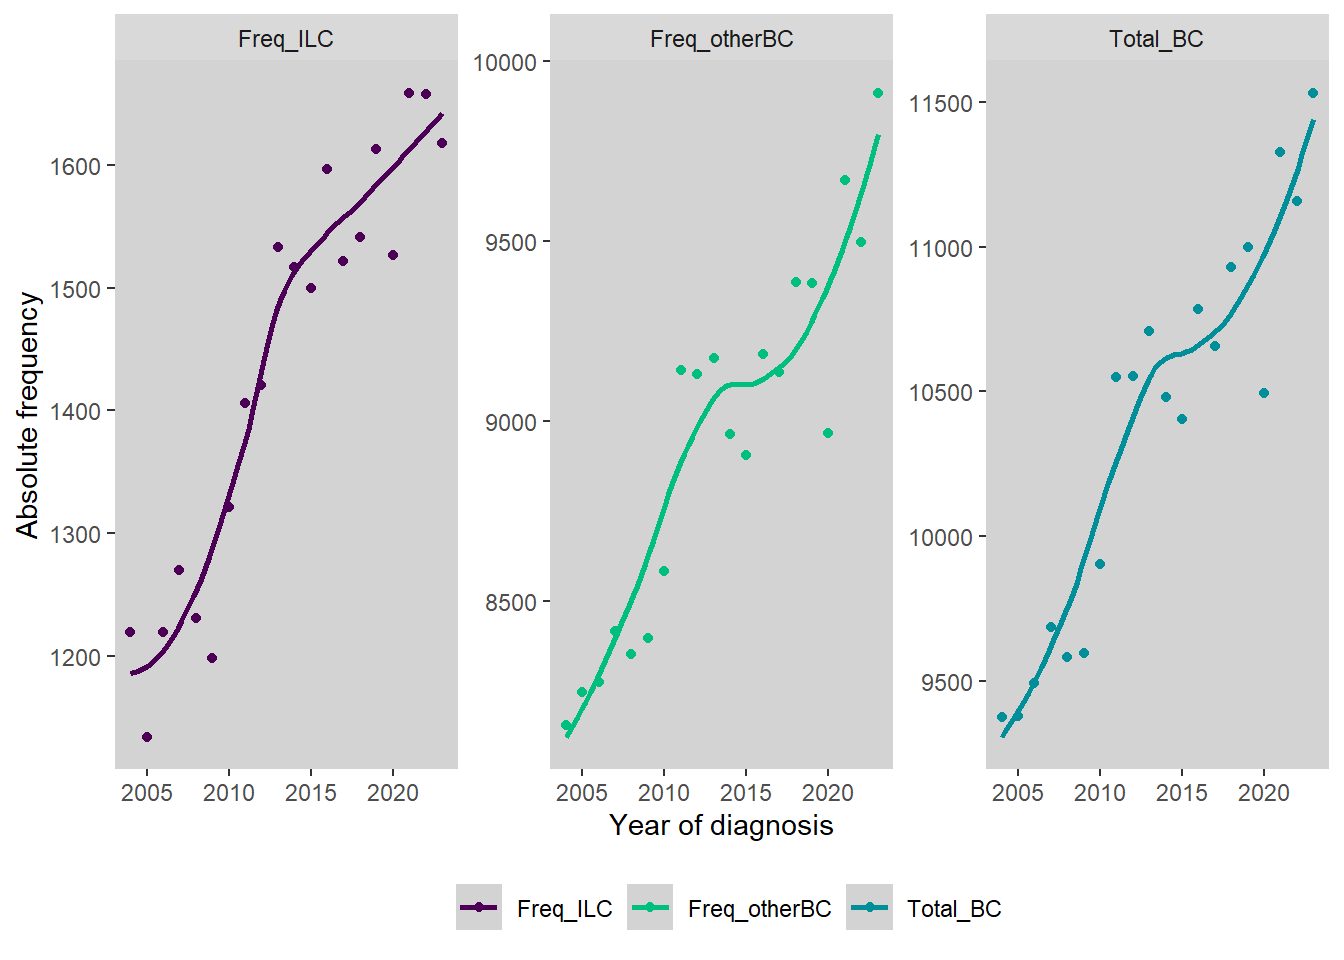
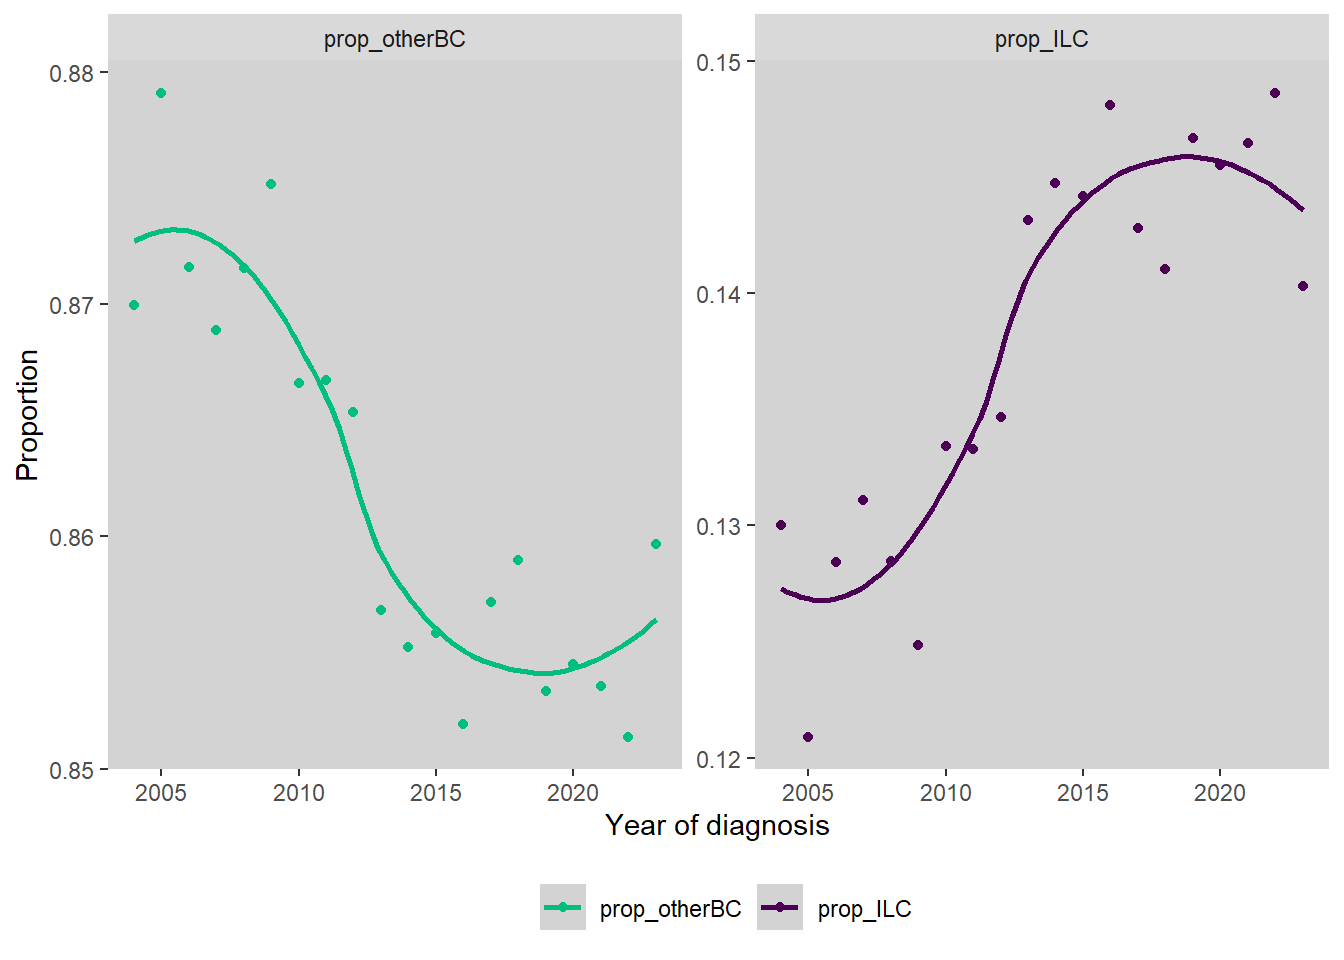
Figure 4.19 shows the raw number of ILC and Other BC diagnoses and total diagnoses for each year between 2004 and 2023. Figure 4.20 shows the raw proportions of cases for each years. For both the representation, a LOESS smoother is applied to identify a general trend. Overall, the absolute number of ILC diagnoses and the absolute number of other BC diagnoses increases in the period 2004-2023.
Also in this case, the likelihood ratio test resulted significant (p = 0.004). Figure 4.21 shows the proportion ratios for each year when 2010 is considered as the reference along with their 95% confidence intervals. Figure 4.22 shows the predicted relative proportions of cases for each year along with their 95% Confidence Intervals.
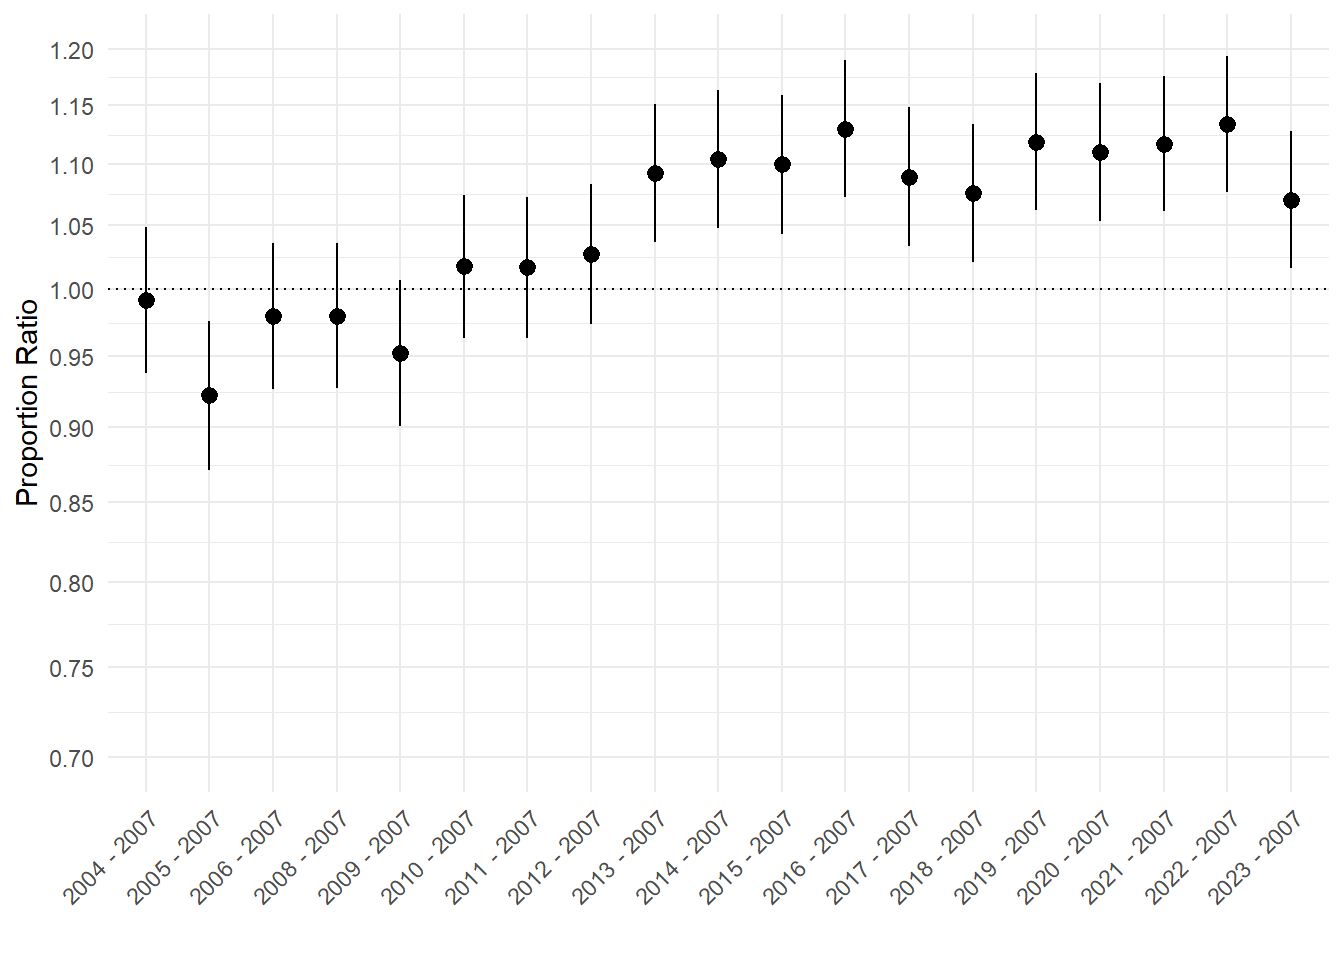
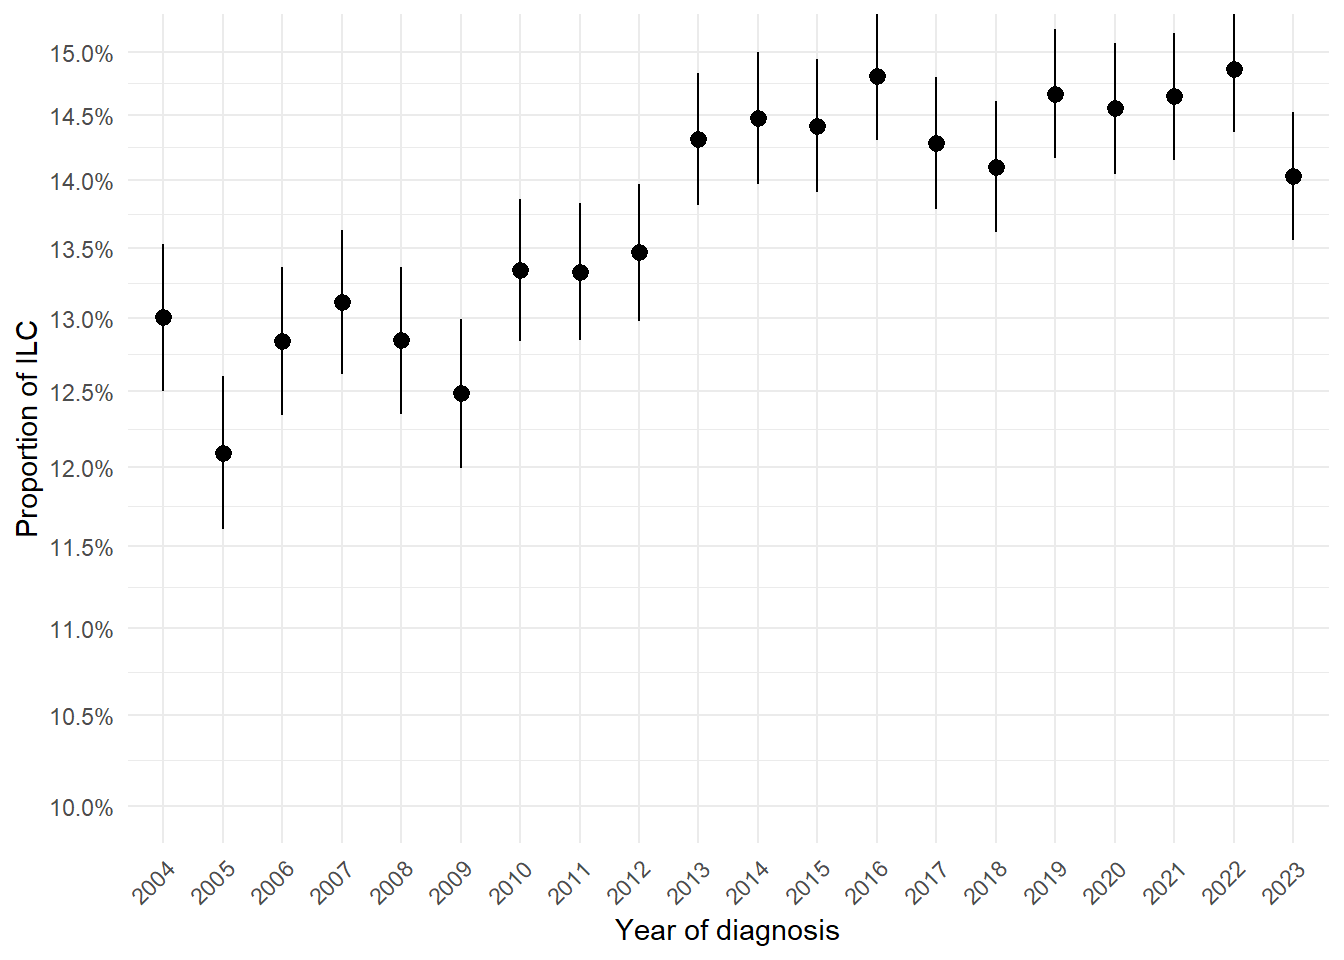
Figure 4.23 and Figure 4.24 show the predicted proportion of cases as a smooth function of the years of diagnosis. The trend identified is non-linear both on the log scale (Figure 4.23) and on the response scale (Figure 4.24).
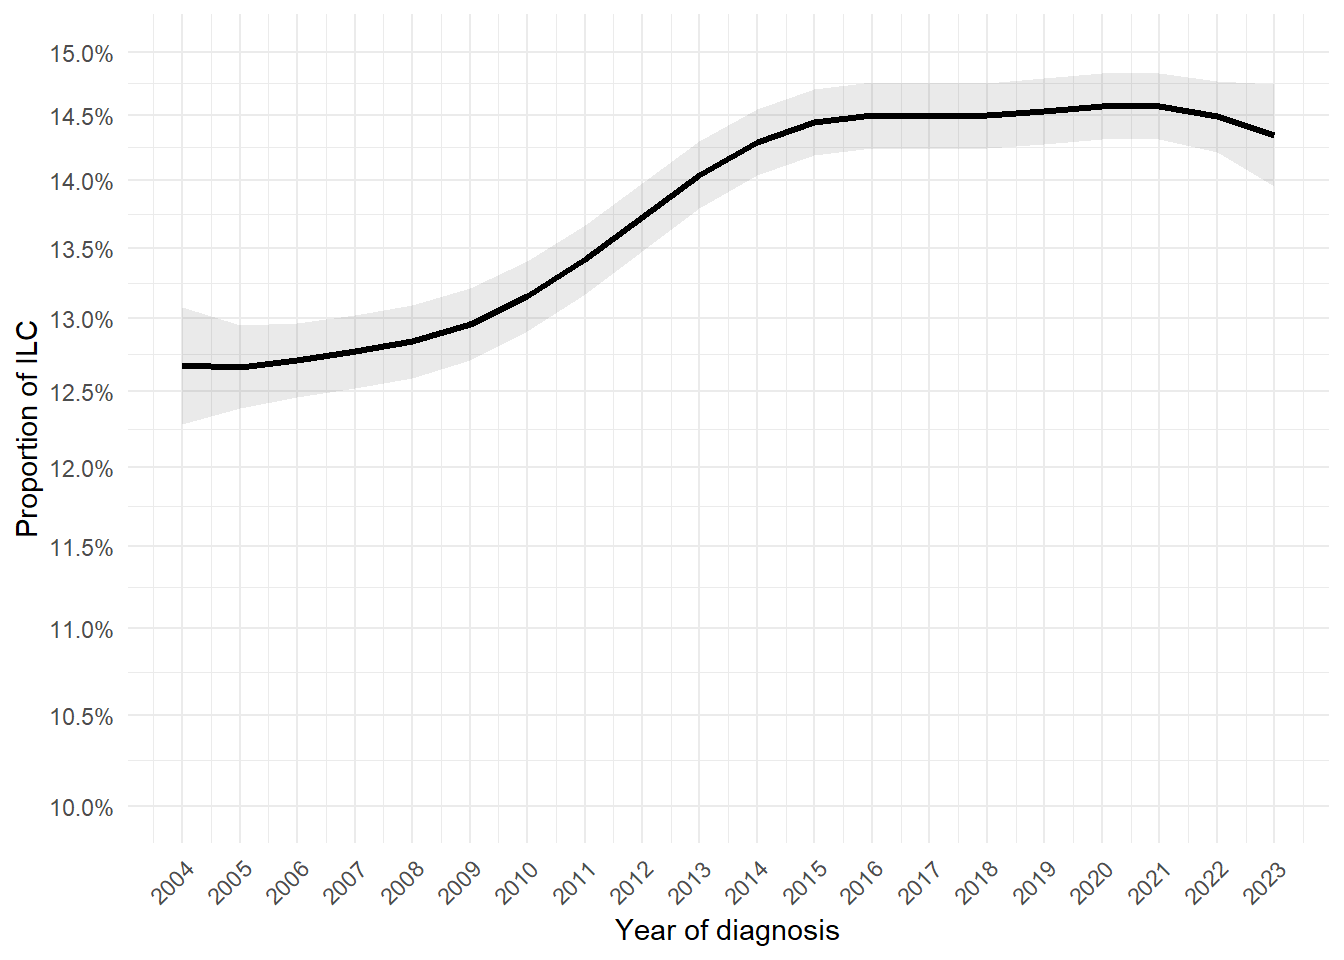
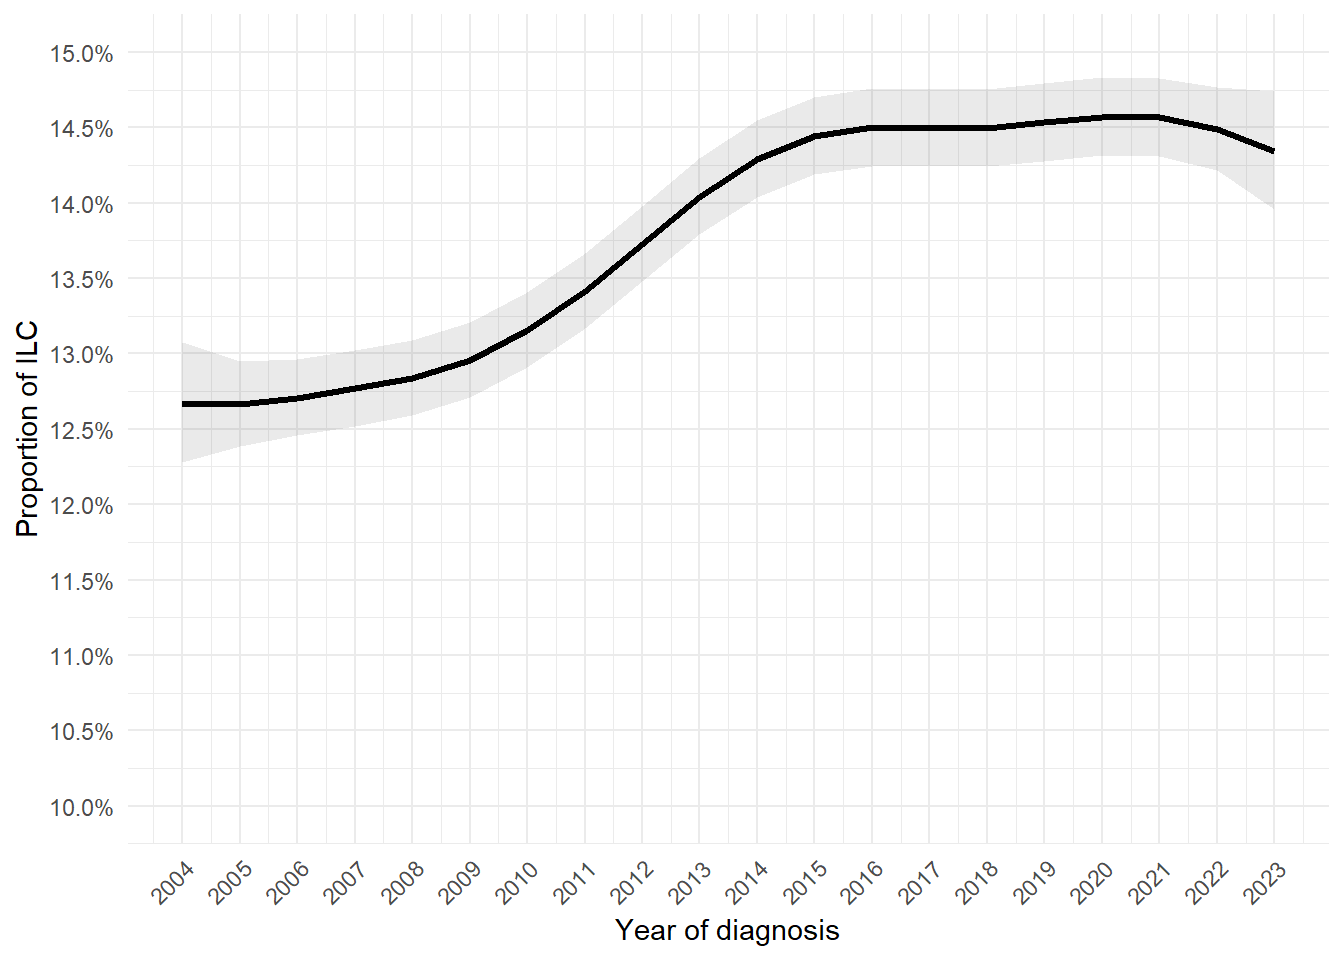
Figure 4.25 shows the raw number of M0 and De Novo M1 and total diagnoses for each year between 2000 and 2023. Figure 4.26 shows the raw proportions of cases for each years. For both the representation, a LOESS smoother is applied to identify a general trend. Overall, both the absolute number of M0 and M1 diagnoses seems to increase over the years. However, the proportion of De Novo M1 seems to increase why the proportion of M0 decreases over time.
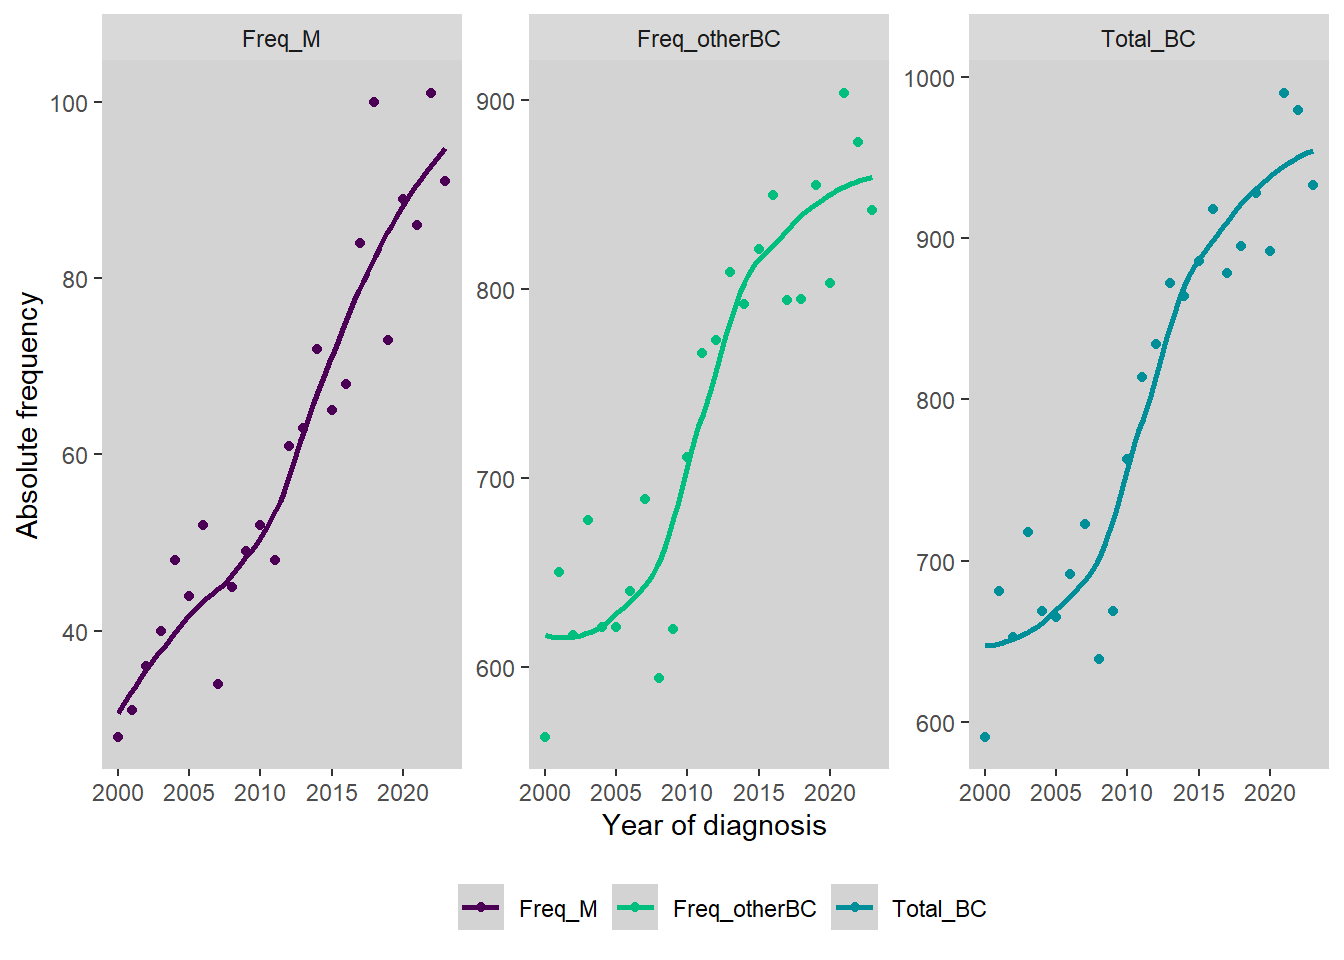
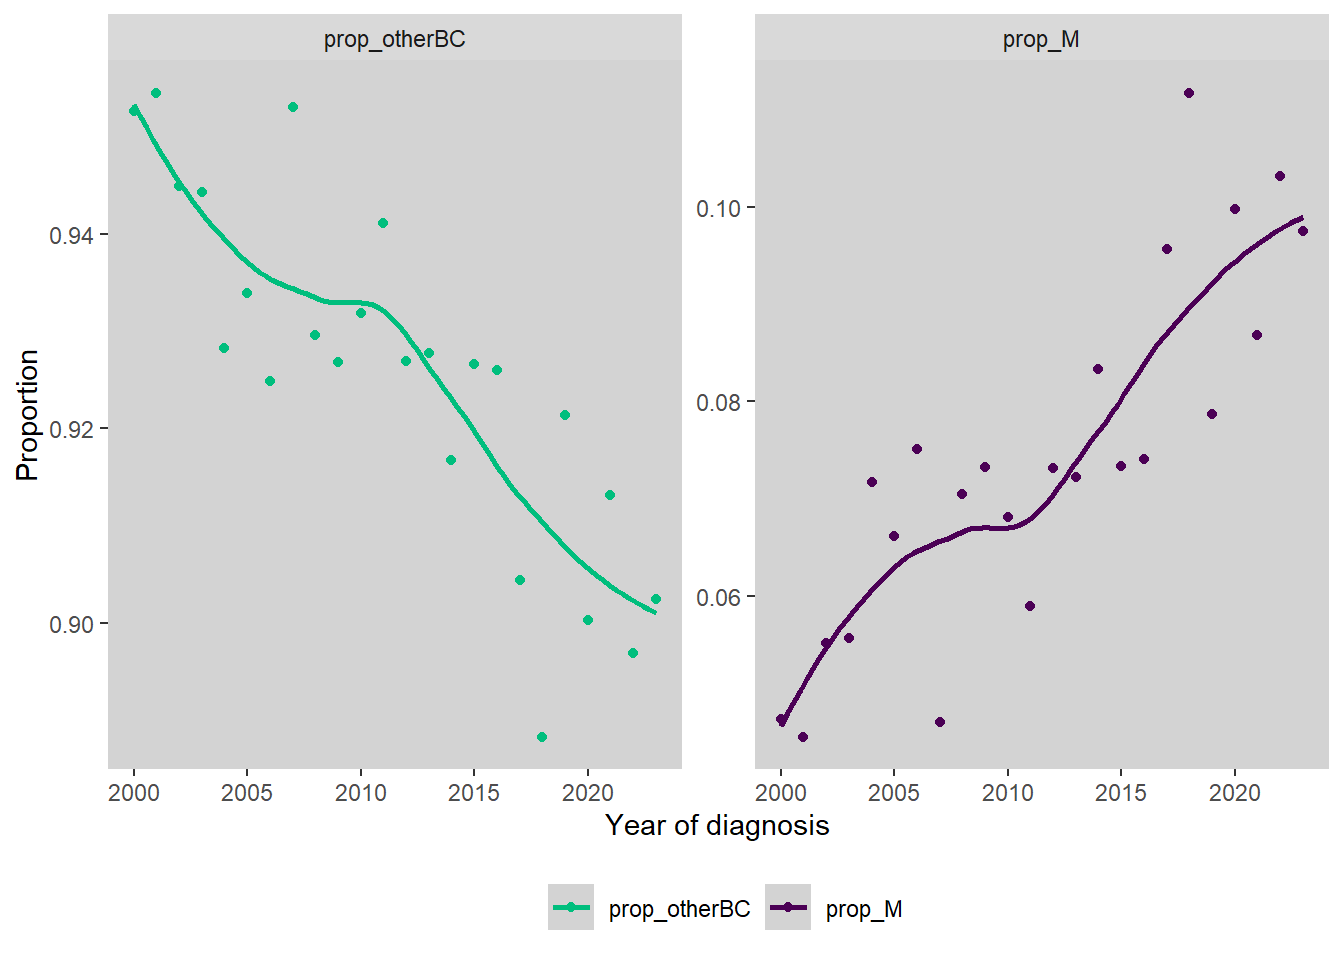
Figure 4.27 shows the proportion ratios for each year when 2010 is considered as the reference along with their 95% confidence intervals. The likelihood ratio test comparing the likelihood of a null model with the model that includes the year of diagnosis indicates is highly significant (p < 0.0001). Figure 4.28 shows the predicted relative proportions of cases for each year along with their 95% Confidence Intervals.
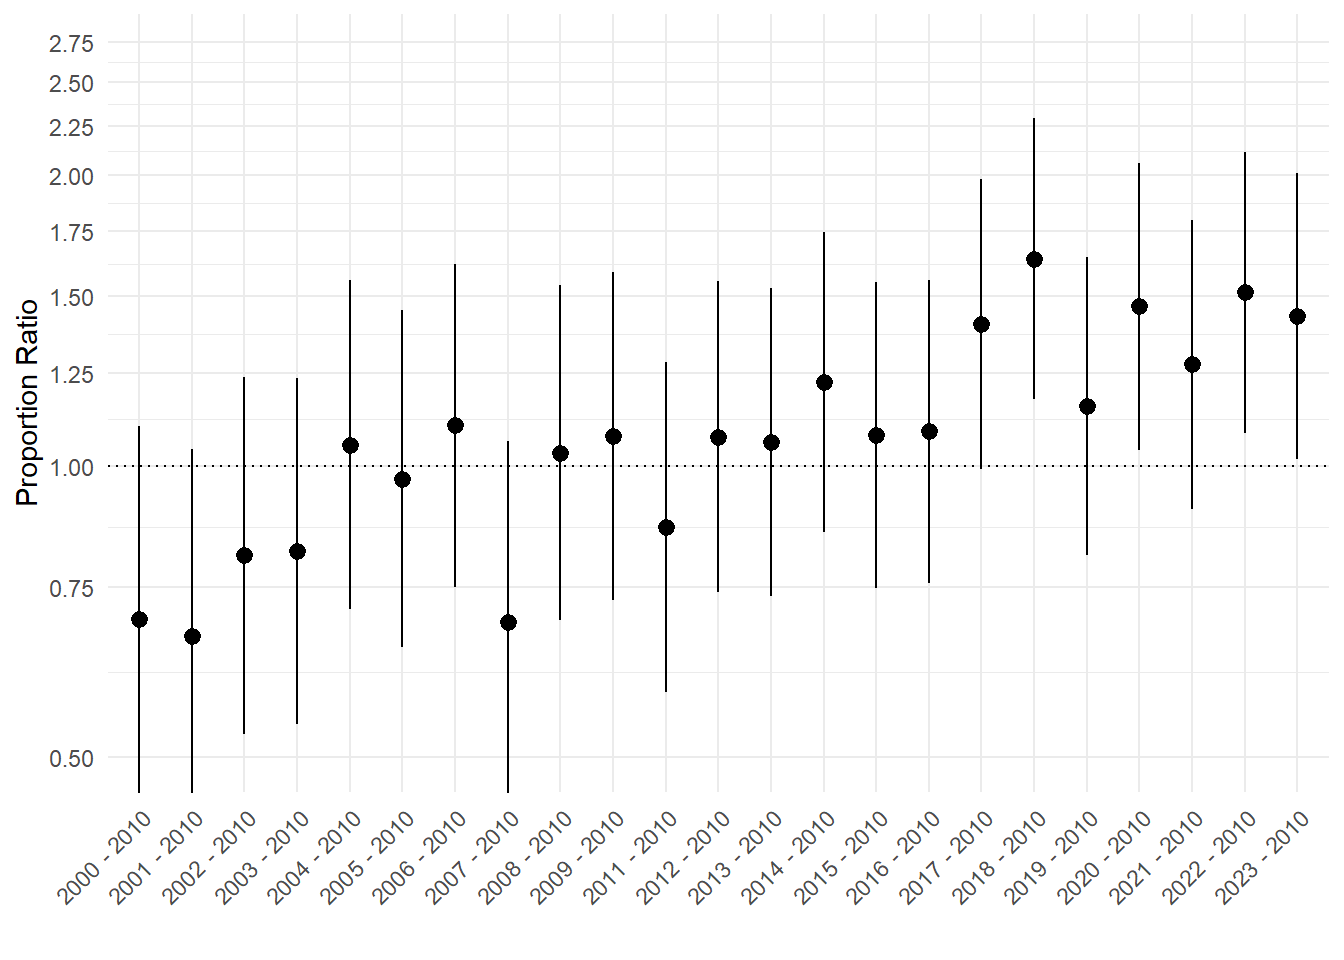
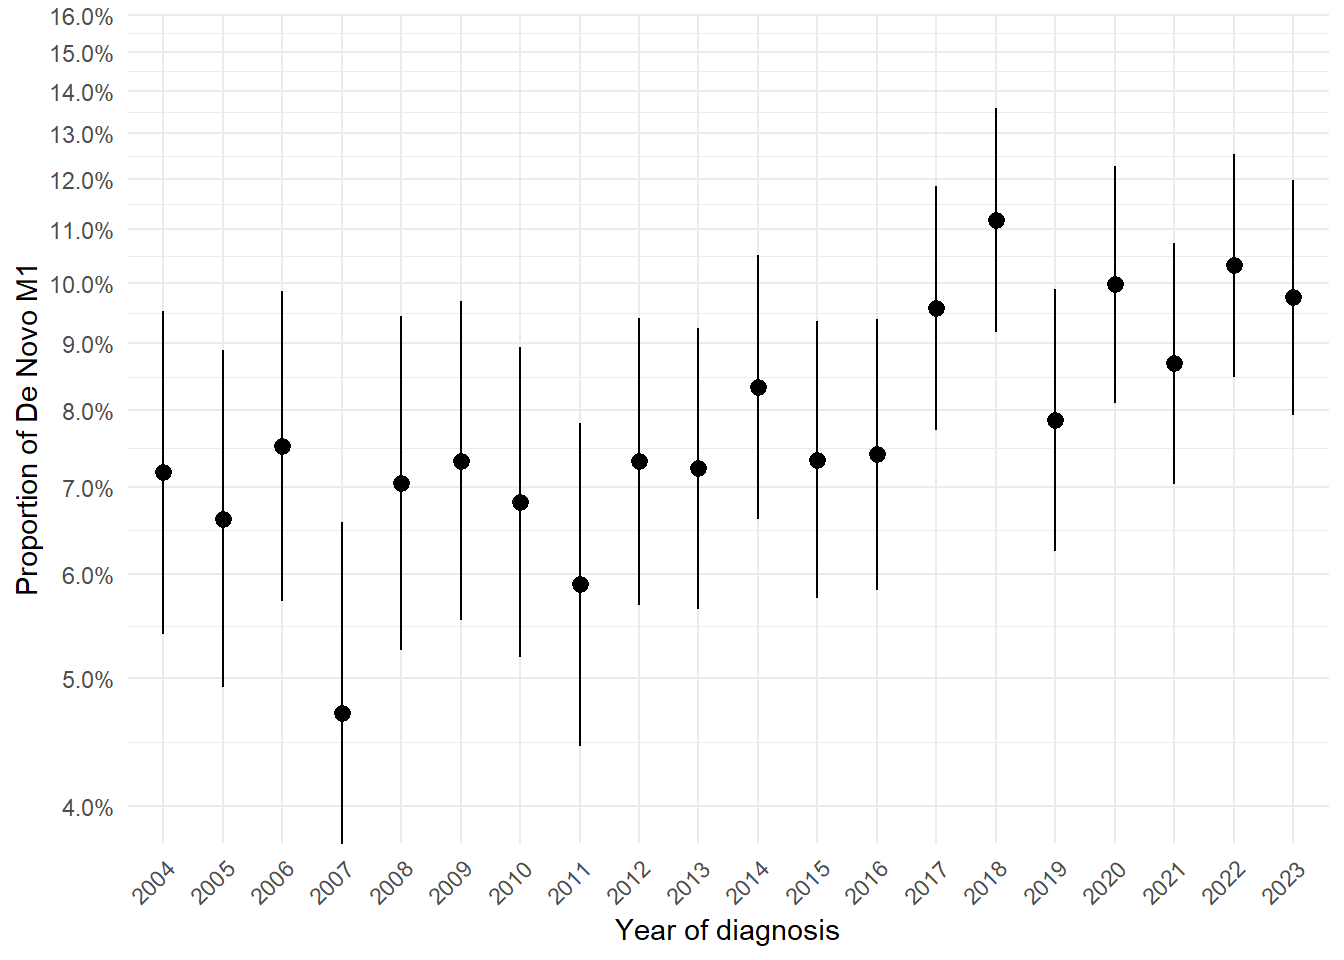
Figure 4.29 and Figure 4.30 show the predicted proportion of cases as a smooth function of the years of diagnosis. The trend identified is basically linear on the log scale (Figure 4.29) and non-linear considering the response scale (Figure 4.30).
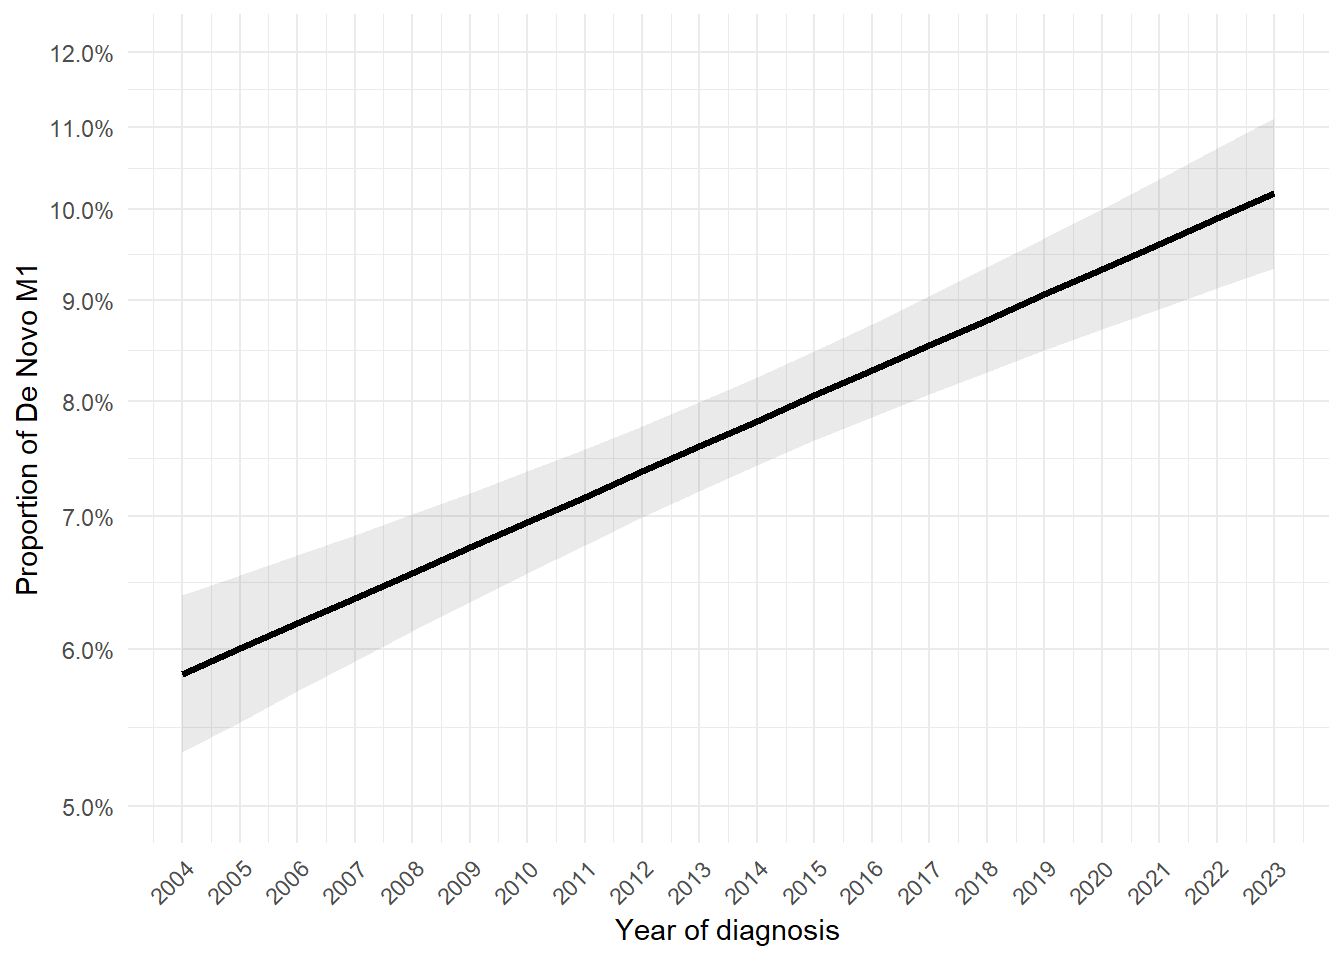
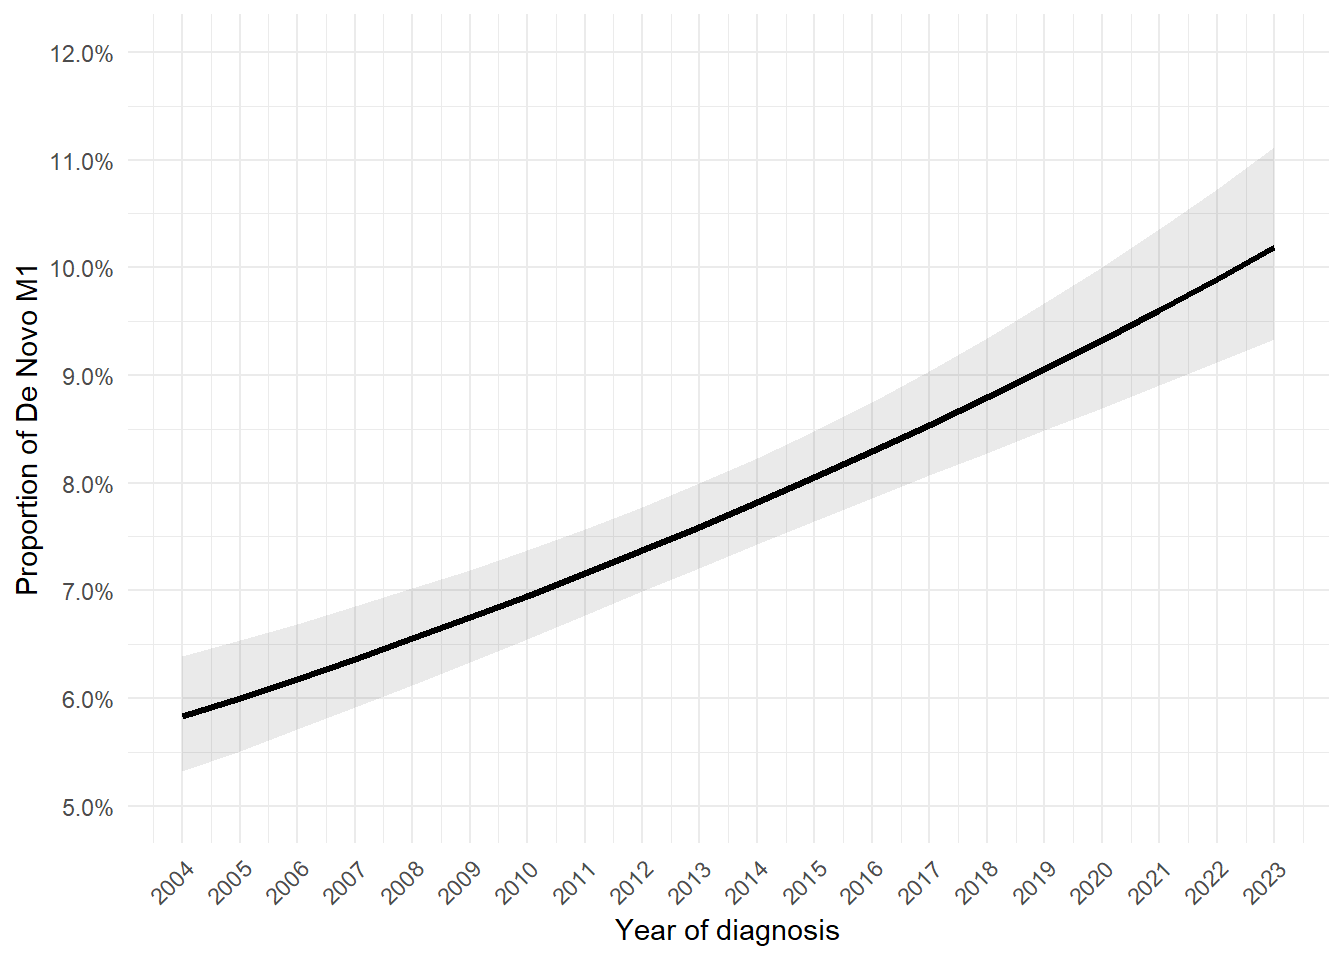
Figure 4.31 shows the raw number of ILC and Other BC diagnoses and total diagnoses for each year between 2000 and 2023. Figure 4.32 shows the raw proportions of cases for each years. For both the representation, a LOESS smoother is applied to identify a general trend. Overall, the absolute number of ILC diagnoses and the absolute number of other BC diagnoses increases in the period 2000-2023.
Also in this case, the likelihood ratio test resulted significant (p < 0.0001). Figure 4.33 shows the proportion ratios for each year when 2010 is considered as the reference along with their 95% confidence intervals. Figure 4.34 shows the predicted relative proportions of cases for each year along with their 95% Confidence Intervals.
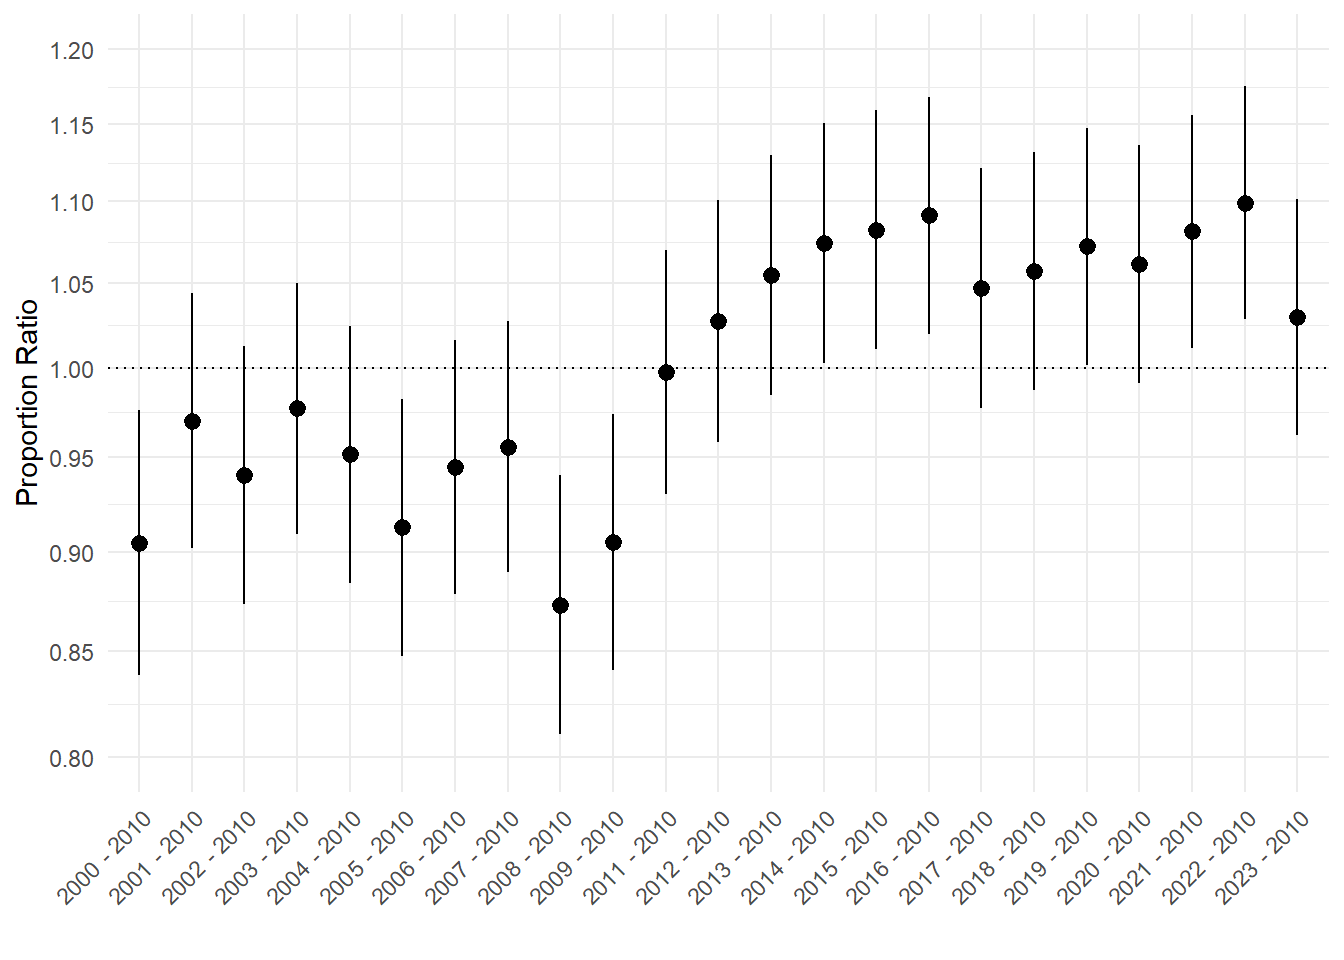
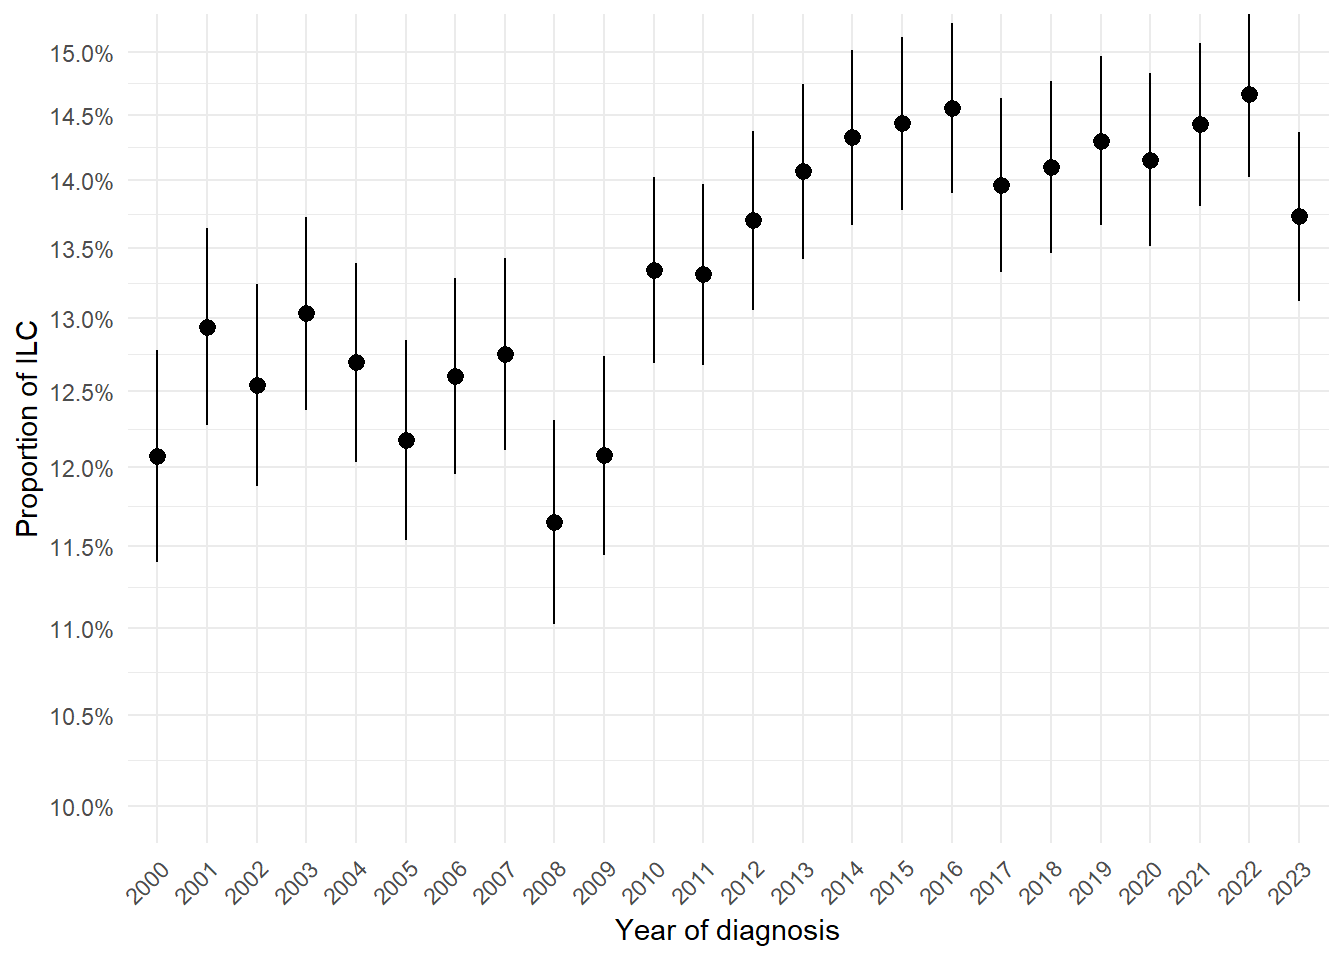
Figure 4.35 and Figure 4.36 show the predicted proportion of cases as a smooth function of the years of diagnosis. The trend identified is non-linear both on the log scale (Figure 4.35) and on the response scale (Figure 4.36).
Use of Hormonal Replacement Post-Menop depending on the year